

|
| Elliott Sound Products | Distortion Measurements |
 Main Index Main Index
 Articles Index Articles Index
|
Please note that this is a long article, so I suggest that you allocate enough time to read it all. Because it covers a wide range of concepts, there's a lot to take in. It's not just a description of one technique, but I've tried to ensure that the reader will understand each of the concepts before moving on to the next.
A complete design for a system is described in Project 232 - Distortion Measurement System, and it has many options that can be added. It relies on a 'high-end' external PC sound card and uses FFT (fast Fourier transform) to extract the distortion components from the applied signal. It's the most accurate distortion measurement system that I've published, and it allows you to measure much lower levels of THD and intermodulation distortion that other distortion meters I've described.
Distortion is a fact of life, because nothing can reproduce an original signal perfectly. This applies in all areas of electronics, and it doesn't matter if the source is audio, video, mechanical or anything in between. Expecting any amplifying device - however it's engineered - to be perfectly linear over its entire operating range (and independent of the load within preset limits) is going to disappoint. Naturally enough, I won't be looking at the other applications (although similar principles apply) - this is about audio.
Firstly, distortion needs to be defined. In this article, we are looking at non-linear distortion, caused by active electronic devices. These can be valves (vacuum tubes), transistors (including all FETs) or ICs. Of these, high-quality IC opamps are without doubt the best, but even they have non-linearities (albeit at almost undetectable levels). The conventional way to minimise non-linear distortion is to use negative feedback, and even if the device is at least reasonably linear to start with, feedback can't cure all ills.
Feedback always works better when the device is already linear, and some forms of distortion cannot be eliminated with feedback (crossover distortion in particular). Why? Because at the crossover point, the DUT (device under test) has very low gain (it may even be zero in an extreme case), and without 'excess' gain you can have no feedback. Most of the distortion we measure is simply the result of non-linearity, something that is unavoidable in any practical circuit.
If an amplifier produces 1V output with 100mV input, but only gives 9.99V with an input of 1V, that's distortion. The amplification is not linear from input to output. The difference may only be 10mV, but that will show up on a distortion meter. The output for negative-going peaks may increase to 10.01V at the same time, and the distortion is therefore asymmetrical. Distortion is indicated whenever an output signal is not a perfect replica of the input. Perfection may not be possible, but many devices come remarkably close.
Another form of distortion is frequency response - if it's not flat from DC to daylight, then technically it is a form of distortion. However, this is not a non-linear function, and it's not included in the general definition. Negative feedback will also improve response characteristics, but that's (mostly) a linear function and is not counted as distortion per se. You can look up the definition of distortion - anything that is altered from its original form is technically distorted.
We (mostly) measure distortion by observing the non-linearity introduced onto a sinewave. A pure sinewave comprises one frequency only - the fundamental. It is a mathematically pure signal source, and it's easy to measure the effects of any changes, notably the addition of harmonics. It is notoriously difficult to generate a pure sinewave. This is discussed at some length in the article Sinewave Oscillators - Characteristics, Topologies and Examples, and while we can get close, the laws of physics will always intervene to thwart perfection. The lowest distortion oscillator I've published is Project 174 (Ultra-Low Distortion Sinewave Oscillator), which was contributed. It has a 'typical' distortion of less than 0.001%, which is approaching the limits that can be achieved other than by high-resolution digital synthesis.
Any changes to the waveform show up as harmonics. Symmetrical distortion produces only odd-order harmonics (3rd, 5th, 7th, etc.). Asymmetrical distortion is claimed by some to 'sound better', and that contains both even and odd harmonics (2nd, 3rd, 4th, 5th, etc.). A very few circuits may produce only even-order harmonics, but the vast majority create both odd and even order harmonics.
At any given point in time, there is one and only one voltage present at any node in a circuit. Complex waveforms such as music may contain many frequencies, but there's still only one instantaneous voltage present at any time point. We can see that on an oscilloscope - the voltage variations may be 'all over the place', but there is still only one voltage present at any point on the composite waveform. The amplifier's job (be it a valve [vacuum tube], transistor, opamp or any combination thereof) is to increase the voltage present at its input by a fixed amount. If the instantaneous input voltage is 100mV and the circuit has a gain of ten, the output should be 1V. Change the input voltage to 1V and the output should be 10V. If it's not, the amplifier has contributed distortion.
The first layer of (non-linear) distortion occurs at the source. Some is intentional (an overdriven guitar amplifier for example), while other distortions are not. A microphone placed too close to a very high SPL (sound pressure level) device (e.g. drums) may distort, and so will a mixing desk if everything isn't set up properly. Mastering equipment may add some distortion (sometimes deliberately) and even the recording medium isn't blameless.
Early tape recorders often had significant distortion, and although performance was improved over the years, tape distortion never 'went away'. There were many innovative techniques used to minimise both distortion and noise, but limitations remained. To this day there are mixing and mastering engineers who will record some tracks (or perhaps the final mix) on an analogue tape recorder to get the 'warmth' associated with vintage electronics. That 'warmth' is largely due to distortion.
The final stage is our playback equipment, much of which is now very close to the ideal 'straight wire with gain'. The loudspeakers remain the weakest link, having distortion that's typically orders of magnitude greater than the electronics used to drive them. There are people who prefer comparatively high distortion electronics (e.g. single-ended triode [power] amplifiers), and others who seek the lowest possible distortion from everything.
In many respects, it's better to think in terms of distortion components in terms of dB rather than a percentage. Stating the THD+Noise (commonly just referred to as THD or THD+N) as a percentage is standard, but when it's stated in dB you know the relative level compared to the original signal. This is quite useful, as it's far easier to estimate the audibility of distortion if you compare the SPL from the system and the relative SPL of the distortion products.
Traditionally, it's been uncommon for the distortion waveform to be provided. This is a real shame, because the waveform tells you a great deal about the nature of the distortion, and can be very helpful to let you work out the likely audibility. Very low numbers don't necessarily mean low audibility, especially if the distortion is 'high-order' (i.e. predominantly upper harmonics). Viewed on an oscilloscope, this type of distortion is characterised by sharp discontinuities (e.g. a spiky waveform), where low-order distortion will show a fairly smooth waveform at twice or three times the input frequency. There will be other harmonics present, but if they are also low-order the distortion is likely to be 'benign' - provided it's at a low enough level. 5% third harmonic distortion may be 'smooth', but it is most certainly not benign. Nor is 5% second harmonic distortion (which will contain some 3rd harmonic as well as 4th, 5th, etc.).
Note that in the drawings that follow, the opamp power supplies, bypass capacitors and pinouts are not shown. This is not a construction article, and all manner of opamps have been used, including discrete types. For metering amplifiers in particular, a discrete option may be preferable because it can be optimised for speed. Gain stages will usually use opamps, as they are now readily available with equivalent input noise of less than 3nV/√Hz (the AD747 is 0.9nV/√Hz). When there are opamps within the measurement loop, it's very important that they don't add distortion of their own. The LM4562 (for example) has a distortion of 0.00003% (-130dB) according to the datasheet.
The voltages used depend on the instrument. The most common is ±15V, but many early meters used higher voltages along with discrete amplifier circuits. For example, the Hewlett Packard 334A used ±25V. More recent (or perhaps less ancient) instruments used opamps and ±15V supplies.
If distortion (THD+Noise) is said to be 0.1%, that equates to -60dB referred to the signal level. -60dB is a ratio of 1:1,000 (or 1,000:1 for +60dB). Using dB by itself lets you work out the SPL of the distortion compared to the signal. If you listen to music at 90dB SPL and distortion is -60dB, that means the harmonics are reproduced at 30dB SPL. This is the same as background noise in a very quiet listening room.
Refer to Table 2.3.1 below for the relationships between dB and %THD. The table uses a reference voltage of 1V RMS, and provides percentage THD, parts per 'n' (from 100 to 1 million), dB and the residual distortion signal. Once the measured 'distortion' is below 0.001% (100μV residual), mostly you are measuring noise. Any distortion that may exist is effectively masked by the noise and the original signal.
The phenomenon called 'masking' occurs where low-level sounds are rendered inaudible by nearby (i.e. closely spaced frequency) louder sounds, so many low-level details are not heard. The MP3 compression algorithm used this feature of our hearing to discard sound that we wouldn't hear. Unfortunately it also misinterpreted much of this, and supposedly 'inaudible' material was discarded and subtle stereo effects were lost. This is commonly referred to as "throwing out the baby with the bath water". Some instruments cannot be reproduced properly by MP3, notably cymbals and the harpsichord.
Of course, this doesn't mean that we cannot hear a signal just because it's at a low level. It's easy to discern the presence of a tone (if it lasts long enough), even if it's more than 10dB below the noise floor. Some tones are easier to hear than others, but the principle is not changed. To hear this for yourself ...
The tone is 12dB below the peak noise level (-6dB) and the average signal level is deliberately at about -20dB (ref 0dBFS). The level of the 550Hz Morse code is 18dB below the noise. One thing that isn't taken into account by this is our hearing sensitivity. As youngsters, we could generally hear down to a few dB SPL (frequency dependent), and at a frequency up to 20kHz (sometimes a little more). As we age our threshold increases (sound must be louder before we can hear it) and high-frequency response falls progressively. At age 20, the maximum audible frequency falls to about 18kHz (give or take 1-2kHz or so). By age 50, most people will be limited to around 15kHz or less [ 1 ]. The threshold of hearing increases from a few dB SPL to 20dB SPL or more as we age, and the amount and type of degradation depends on how much loud noise we subject ourselves to over our lifetime.
For some perspective, consider a 10kHz frequency that's subjected to 0.1% distortion. If the distortion is symmetrical, the first harmonic generated is the third (30kHz). With asymmetrical distortion, the first generated harmonic is at 20kHz (2nd harmonic), the next at 30kHz, etc.
We know these are at around -60dB, and it should be apparent that they are inaudible to any listener beyond the early teens, even in a very quiet room. However, there's something else at work - intermodulation distortion (IMD). This is more serious than 'simple' THD, as it causes frequencies to be generated that are not simple harmonics. If a 1kHz tone is mixed with a 1.2kHz tone in a non-linear circuit, you get new frequencies that are multiples (or sub-multiples) of the original frequencies, as well as (perhaps) 3.2kHz and 200Hz (the sum and difference frequencies). However, there are complex interactions that are discussed in detail in the article Intermodulation - Something 'New' To Ponder.
In this article, I will mainly concentrate on harmonic distortion. Whenever there is harmonic distortion, there is also intermodulation distortion - you can't have one without the other. Despite the points made in the above-referenced article, there is normally no condition where distortion is 'perfectly' symmetrical, because music presents a waveform that's rarely (if ever) completely symmetrical other for the odd brief period. Measurement systems are another matter, and they cannot rely on the generation of sum and difference signals. IMD is covered later in this article.
The traditional way to measure THD (actually THD+N) is to use a notch filter. This removes the original frequency, and everything left is distortion and noise. To get 'pure' THD (without the noise) requires the use of a wave analyser (tunable filters that pass a very narrow band of frequencies (ideally just a single distortion frequency by itself). The analyser is tuned to the harmonic frequencies and the amplitude is measured. Most modern digital spectrum analysis uses the fast Fourier transform (FFT) method to isolate the harmonics. THD is calculated using the following formula ...
THD = √(( h2² + h3² + hn² ) / V ) × 100 (%)
Where V = signal amplitude, h2 = 2nd harmonic amplitude, h3 = 3rd harmonic, hn = nth harmonic amplitude (All RMS)
For those who don't like playing with maths, there's a handy spreadsheet (in OpenOffice format) that you can download. Click Here to download it. You only need to insert the level of the fundamental and as many harmonics as you feel like adding (up to the 10th) and it will calculate the THD. Note that noise is not included. All measurements are in dB, referred to 0dBV (1V RMS), and can be read directly from a fast Fourier transform.
In contrast, a notch filter removes the fundamental, and everything left over is measured. This includes all harmonics, intermodulation artifacts, noise (including that generated in the measurement system), hum, buzz, and anything else that is not the original frequency. If the notch isn't deep enough, some of the fundamental will get through, but looking at the residual on a scope will show that clearly.
Now we have to decide how good the notch filter needs to be. If the fundamental is reduced by 40dB, it's not possible to measure less than 1% distortion, because 10mV/V of the input signal (the fundamental) sneaks past the filter. A low distortion amplifier will show a distortion residual that's at the test frequency, and it may show an almost perfect sinewave on an oscilloscope.
Any measurement of THD should include the ability to look at the output waveform after the notch filter, as the nature of the distortion is often a very good indicator of its nature and audibility. A smooth waveform with no rapid discontinuities indicates low-order distortion, but if the waveform is 'spiky', it's likely that the DUT (device under test) has either clipping or crossover distortion. A simple measurement of the RMS or average level may give a satisfactory reading (e.g. 0.1%), but the distortion is clearly audible. Another DUT with the same THD but without the sharp (spiky) waveform will sound very different.
This is (supposedly) one of the reasons that some early transistor amplifiers were disliked, even though their distortion measurement was far lower than the valve (vacuum tube) designs they tried to replace. This dislike (sometimes extending to hatred) appears to be continued to this day by some 'audiophools', who insist that only valve amps can provide true audio nirvana. This isn't an argument that I intend to pursue further. However, consider that valve amps very rarely undergo the same level of scrutiny as opamps or other transistorised circuitry. It's probable that most valve amps would prove to be 'disappointing' if subjected to the same intense analysis.
There's a school of 'thought' that maintains that testing with a sinewave is pointless, because real audio is far more complex. The proponents of this philosophy utterly fail to understand just how difficult it is to produce a high-purity sinewave, and how the tiniest bit of distortion is easily measured. There's no doubt whatsoever that a sinewave is 'simple' - it's a single tone which has one (and only one) frequency - the fundamental. However 'simple' a sinewave may be, producing (or reproducing) it perfectly is impossible. Just as there is no such thing (in the 'real-world') as a perfect sinewave, an amplifying device with zero distortion doesn't exist.
It is possible to test an amplifier with a 'complex' stimulus, including music. However, it's quite difficult to do, because real amplifiers introduce small phase shifts, propagation delays and tiny level deviations that make it very hard to null the output with any accuracy. It has been done though, with the method first described by Peter Baxandall (of tone control fame) and Peter Walker (QUAD).
The technique was used 'in anger' when critics claimed that the QUAD 'current dumping' amplifier couldn't possibly work well, so a test was set up that used the output from the amplifier, mixed with the input signal in a way that the two cancelled. Once the two signals were perfectly matched in level and phase, any residual was the result of distortion in the amplifier. The results silenced (most of) the critics. This is a very difficult test to set up, and it requires very fine adjustments of phase and amplitude over the full audio band. It should come as no surprise that it's not used very often.
Cancellation also relies (at least to some extent) on the music being played for the test. Material with extended high frequencies may require more exacting HF phase compensation, with a similar requirement for particularly low frequencies. The specific compensation will also be affected (at least to some degree) by the load, as no amplifier has zero output impedance. These requirements all conspire to make the setup process very demanding. The output level will also be very low with a high-quality amplifier, so it will need to be amplified to make it audible. If the distortion products are at -60dB referred to a 1V of signal, you'll only have one millivolt of residual distortion. Wide-band cancellation techniques are not covered further here.
Distortion meters come in two main types - continuously variable (with switched ranges) or 'spot' frequency types. Common frequencies for spot frequency meters are 400Hz and 1kHz. This type lacks flexibility, but for a DIY meter you can have several separate notch filters to look at the frequencies you want. If you wanted to use three frequencies, a reasonable choice might be 70Hz, 1kHz and 7kHz. If the tuning resistance is 10k, you'd use 220nF caps for 72Hz, 15.9nF caps for 1kHz (12nF || 3.9nF) and 2.2nF caps for 7.2kHz.
Continuously variable meters are much harder, and will almost always use something other than Twin-T filters so that the tuning pots are not a 'special order'. Variable capacitors are better, but make everything more difficult (and noisier) because of the high resistances needed. With continuously variable frequency, any mismatch between the gangs (pots or capacitors) requires careful adjustment of the null, usually with series (low value) pots. For example, if you use 10k tuning resistors/ pots, 10-turn 200Ω wirewound pots are ideal for fine tuning.
The most common method for measuring THD+N is single-frequency cancellation, where the only frequency that's rejected is the fundamental. We measure what's 'left over', and that becomes our measurement. The original input signal must be as close to a 'perfect' sinewave as we can get, and it's then a simple matter to determine the non-linearity contributed by the DUT. Measuring below 0.01% THD+N is not easy using this technique, because noise often becomes the dominant factor.
Despite the differentiations shown below, all notch filters rely on phase cancellation. At the test frequency, the signal is effectively divided into two 'streams', with one having 90° phase advance and the other having 90° phase retard. The other method is to allow one signal to pass unaltered, and retard (or advance) the phase of the other by 180°. Perfect cancellation can only occur at one frequency, where the two signals at the selected frequency are exactly 180° apart. This creates a notch, which in an ideal case would be infinitely deep at the tuning frequency. In practice, it's unrealistic to expect more than 100dB rejection of the fundamental, which leaves the original signal (the test frequency) reduced such that a 1V input results in an output of 10μV (0.001% THD). As noted above, a major part of the residual signal will be random noise.

Whether it's for simulations or bench testing, a method of generating distortion is useful. The example shown is a simple but effective way to generate distortion, with the ability to select even-order or odd-order distortion products. It assumes that the sinewave generator's output impedance is 600Ω. The distortion I measured was roughly 0.083% (588μV) for odd-order and 0.117% (828μV) for even-order. It's not 1% as you might guess from the ~1:100 ratio between the oscillator's output impedance and R1, because the diodes don't start to conduct until the voltage across them is about 0.65V, and the AC peak voltage is only 1V (707mV RMS). If you have an oscillator with a different output impedance, then change the value of R1 proportionally. The distortion that's generated is sensitive to level changes.
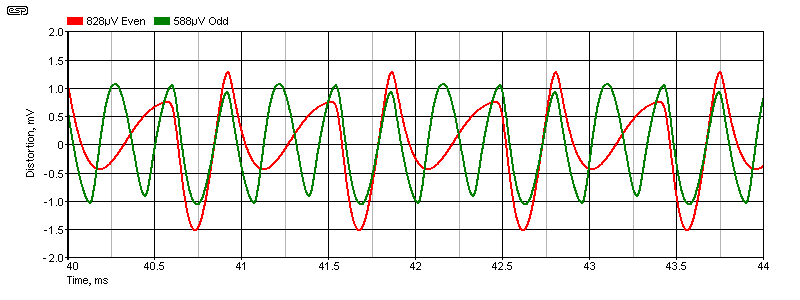
The residuals have no particularly sharp discontinuities, so the waveforms are relatively smooth. That doesn't mean that they are exclusively low-order, because any (real world) distortion may extend to at least 10 times the fundamental frequency. However, most will be so far below the system noise level that they won't be audible. Simulating a distortion waveform with sharp discontinuities is not as easy, because an active device with (for example) crossover distortion has to be simulated (or constructed) as well. A crossover distortion 'generator' is shown in Fig. 2.1.1 (A).
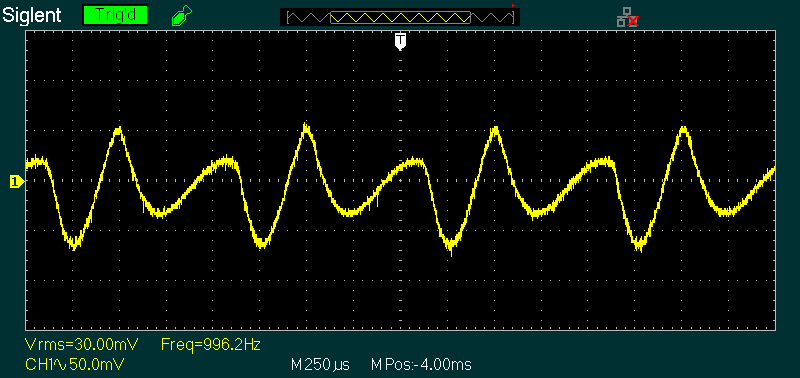
The scope capture shown was with a single diode in series with 100k across the oscillator's 600Ω output. The distortion measurement was 0.085%, and is largely 2nd harmonic. The presence of higher order harmonics is indicated by the (comparatively) rapid transitions seen on the most positive peaks. I used 4 averages on the scope - not because the trace was particularly noisy, but to show a 'cleaner' waveform. Compare this trace to the red trace in Fig. 2.2, which is also even-order distortion, but simulated. The waveforms are not identical, but are very close. This demonstrates that the simulations are very close to reality (but only when all factors are included in the simulation). With two diodes the measured THD increased to 0.1%.

Being able to look at a detailed spectrum is something I've just recently got working again, after a lengthy hiatus (mainly due to a number of PC reassignments). I have a TiePie HS3-100 PC scope which has better resolution than a stand-alone digital scope. The level into the Fig. 2.1 distortion generator was adjusted to get exactly 0.1% THD+N, and the spectrum shows the harmonics. The 2nd, 3rd and 4th harmonics are visible above the noise. Overall noise is at about -95dBV, with the 400Hz tone at -5dBV (562mV RMS). The harmonics are at -67dBV (447μV), -70dBV (316μV) and -76dBV (158μV). Using the formula shown above, that gives a THD (without noise) of 0.076%. There is 50Hz mains hum visible, along with its harmonics (up to the 5th). To be able to get lower overall noise and better resolution requires far better equipment than I can afford.
It's also worth noting that the 600Ω source resistance has a noise contribution of 3.16nV/√Hz, which works out to a total noise level of 1μV for a 100kHz bandwidth (-120dBV). For the audio range (20kHz bandwidth), that falls to 0.438μV. Most of the noise seen is from the PC scope adapter, with a small contribution from the 400Hz filter used at the output of the signal generator.
One way you can improve the resolution of measurements is to use a good notch filter to remove (most of) the fundamental, then use FFT to examine the harmonics. You will need a very good preamp to boost the level sufficiently to allow the PC scope (or high-quality sound card) to resolve the distortion components, remembering that if you start with 1V and measure 0.1% THD, you only have 1mV of signal coming out of the notch filter. A good opamp can raise the level enough to make it easy to measure with suitable software. The preamp has to be low-noise, but ultra-low distortion isn't a requirement.
This topic deserves its own sub-heading, because it's so often referred to, and poorly understood - or so it seems from forum queries and the number of articles on-line. There are countless websites where the author(s) still claim it's a common problem. It isn't. Most people with sufficient electronics knowledge know what crossover distortion is, and a few may also know what it sounds like. The point that seems to be missed is why negative feedback doesn't cure it. An 'ideal' amplifier (having effectively infinite gain) will reduce crossover distortion to negligible levels, but that requires a broad-band gain of more than 100dB (100,000V/V) to get crossover distortion down to 0.001%, but due to its nature it may still be audible! No 'real life' circuitry can provide enough gain at all frequencies to overcome the crossover distortion caused by an un-biased output stage.
Crossover distortion was referred to in the introduction as one type of distortion that cannot be removed by feedback. This requires further explanation, because it probably doesn't make sense. Other forms of distortion are reduced, so why not crossover? The answer lies in the cause of crossover distortion in the first place. Refer to Fig. 2.2.1 (A) showing a basic amplifier that will have crossover distortion because the output transistors are unbiased. The second amp (B) has bias. Both amps have a gain of 10 (20dB), and were simulated with a 10mV (peak) input, resulting in an output of 100mV (peak), or 70mV RMS. The test frequency was 1kHz. Close to identical results will be obtained if you build the circuit. An 'ideal' opamp reduces the distortion simply because it has nearly infinite gain and slew rate, but it is still unable to eliminate it.
Crossover distortion (sometimes called crossover 'notch' distortion) is generated to some degree in any Class-B or Class-AB output stage, as the output devices conduct on alternate half-cycles (see Fig.2.2.2). There is always some discontinuity during the changeover, but it hasn't been a major concern for a very long time. In reality, 'true' Class-B is almost unheard of, with all common designs using biasing to ensure that neither output transistor turns off with no (or a zero-crossing) signal. Despite innumerable websites (forum sites in particular) complaining about it, crossover distortion has not been a major failing of any passably sensible power amplifier.
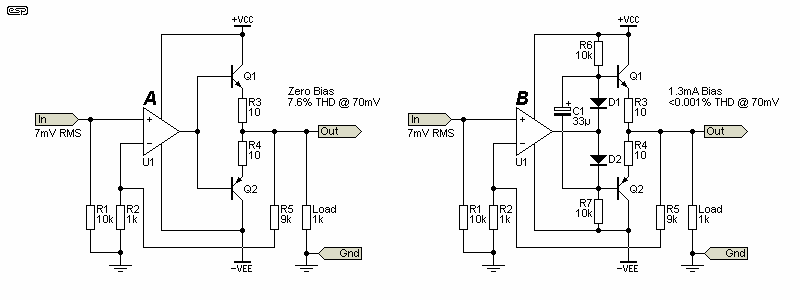
Real opamps have real limits, and the opamp's output voltage must swing ±650mV before the transistors can conduct. This takes time with an AC input. A good opamp may have a slew rate of 20V/μs, so it will take 50ns to change by 1V. When the input signal level is zero, the opamp has nothing to amplify (and it's operating 'open-loop'). The circuit's overall gain is zero because the output transistors are both switched off. The transistors won't turn on until the opamp's output is at ±650mV. A few microvolts of input will be enough to create this, but the opamp is operating open-loop (no feedback) until either Q1 or Q2 starts to conduct. By applying (just enough) bias using R6, R7, D1, D2 and C1, the transistors will conduct (about 1.3mA in a simulation), so the overall gain no longer falls to zero at zero volts output. If the zero bias amplifier is tested with a notch filter, you'll see an output similar to that shown next. Crossover distortion gets worse with reduced signal levels.

There is an expectation that some non-linearity must exist in any real circuit, and to obtain good performance it must be minimised. The Fig. 2.1.1(B) circuit does that by ensuring that Q1 and Q2 pass some current, so the output stage gain cannot fall to zero. This is a simplification, because power transistors used to have very low hFE at low current. Most of the ones we use now have very good gain linearity (even down to a few milliamps for the best of them). By applying enough bias to ensure the output devices are within their linear range, crossover distortion is all but eliminated in the output stage. Transistors such as the MJL3281/1302 (NPN/PNP) have almost perfect gain linearity down to 100mA collector current or less. The optimum bias current is determined by testing the final amplifier for lowest distortion at ~1W output.
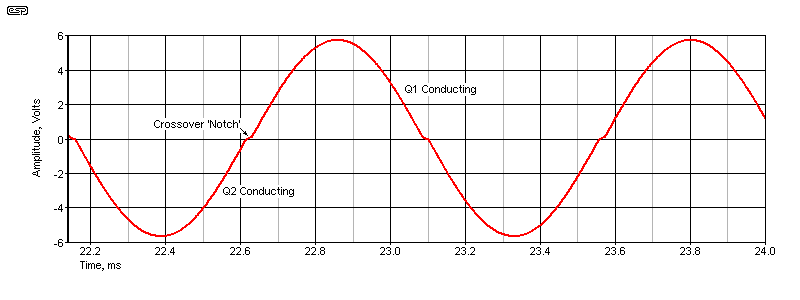
Fig. 2.2.2 shows exaggerated crossover distortion. The 'notch' is the point where neither Q1 nor Q2 is conducting, so there is no output. The amount of distortion is far greater than that shown in the residual below, simply because the lower levels are invisible, even on the simulator. Reality is no different, and even quite unacceptable levels of crossover distortion may not be visible on an oscilloscope trace. Because this applies to the simulator too, I made it a great deal worse for this trace than was used to produce Fig. 2.2.3. Just because you don't see it on a scope doesn't mean it's not there! The simulator tells me that the distortion is over 2.6%, and the harmonics are all greater than 10mV to beyond 20kHz, with the third harmonic being at 100mV for a 5.5V peak output.
To understand why the measurement is often inaccurate, consider a 700mV output signal subjected to crossover distortion. The residual has peaks of 47mV on the residual (seen above), but an RMS measurement shows only 5.6mV. An average-reading meter (used in most distortion meters) will indicate ~2.15mV, which is an even worse underestimate! So, while the distortion measurement may show less than 1% THD, the output will sound dreadful. The simulator I use will tell me that the rough-and-ready 'amplifier' I created for the simulation (Fig 2.1.1 (A)) has only ~0.8% THD at 700mV RMS output, but a fast Fourier transform (FFT) shows harmonics extended to over 100kHz with not much attenuation (the harmonics are odd-order, and are all greater than 2mV [with a 1V peak output signal] up to 20kHz). The spiky nature of the waveform shown is typical of distortion that may measure alright, but is easily distinguished by ear as being inferior to another amplifier with the same measured THD but without crossover distortion. This is why it's so important to understand how these measurements work.
If the same 'rough-and-ready' amplifier's output is increased to 7V RMS output, the distortion component increases to 10mV (RMS) (3.45mV average) but 150mV peak! The calculated or measured distortion is reduced to 'only' 0.14% (0.048% average-reading), but the spiky waveform is still easily heard with a single tone or audio, and intermodulation products are very audible. This may have been situation with some early amplifiers, which measured 'better' than equivalent valve amps of the day, but sounded worse. An oscilloscope shows the problem very clearly. You can also use a monitor amplifier to hear the output. Be very careful, as the notch filter is very sharp, and even a tiny frequency change will cause the output to increase by anything up to 60dB (instant monitor amp clipping and very loud). The difference between valve and transistors is more complex than just distortion performance, with output impedance causing audible frequency response changes.
We expect that any modern amplifier using good (linear) output transistors will have undetectable levels of crossover distortion. Most integrated circuit power amps (e.g. LM3886, TDA7293) are also very good. Few (if any) commercial amplifiers will be found wanting either. It used to be that only Class-A amps could be counted on to lack crossover distortion, but this is no longer the case. One point that is entirely missed by nearly everyone is that crossover distortion and clipping distortion are essentially identical, but the phase is changed. For a given percentage of crossover or clipping distortion, the harmonics have the same amplitude and frequency distribution. In reality, this is not something we worry about - we expect distortion when an amplifier is overdriven, but not at low power levels.
As an example of a 'typical' IC power amplifier, I ran a test on my Project 186 workbench amplifier. At 1W output (2.82V RMS/ 8Ω) the distortion was 0.004%, most of which as noise. There was zero evidence of crossover distortion. When the output level was raised to 5V RMS (3.5W), the measured distortion was below my residual of 0.002% THD+N. With such low harmonic distortion, that also means that IMD (intermodulation distortion) is also low, and again (probably) below my measurement threshold. The same applies to the other project amplifiers on my site where a PCB is offered. None has any evidence of crossover distortion if set up according to the instructions. There is one exception - Project 68. It's designed specifically as a subwoofer amp, and the small amount of distortion is inaudible with any subwoofer loudspeaker. While it's measurable, no-one has ever said it's audible (and I've run many tests on it, including full range audio).
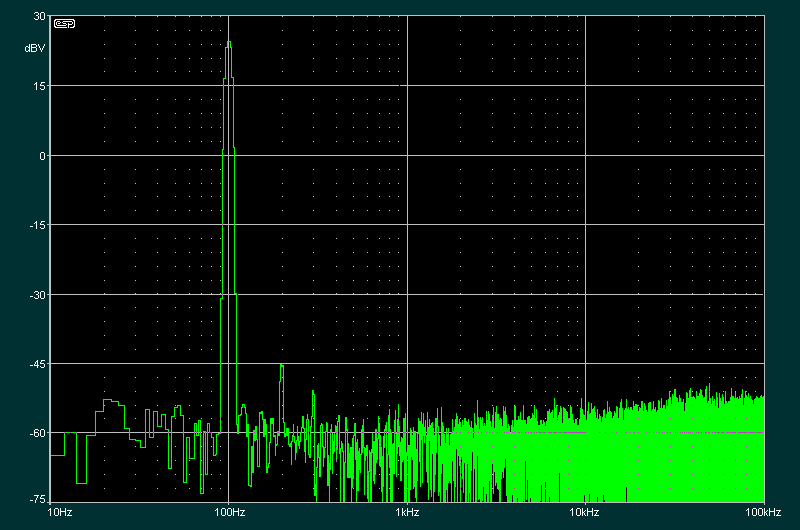
The measured distortion at 1W output is less than ~0.2% based on the peak distortion residual. For reference, a spectrum of the distortion is shown above, with an output of 40W at 100Hz. The only visible distortion products are 70dBV or more below the peak, so despite the crossover distortion, it still sounds clean. With bass only (as intended), the loudspeaker is unable to reproduce the higher frequencies anyway. While it's possible to bias the output stage for no visible crossover distortion, there's no reason to do so. The design of P68 was specifically to ensure high power and complete thermal stability, without any adjustments.
Crossover distortion is not limited to transistor amplifiers - it happens with valve (vacuum tube) amps as well. There's usually a fine balance between getting clean output at low power and not pushing the valves past their limits at high power. This has become harder because the valves you can buy today are nowhere near as good as those from the 1960s and 1970s. Amps designed to use RCA, Philips, AWV (Australian Wireless Valve company), Sylvania etc., etc. will often stress the valves, but the old ones could take it (and they were cheap then as well). Modern valves are generally more easily damaged by overloads, so the grid bias voltage on the output valves may be set a little more negative to reduce dissipation. This can lead to crossover distortion. It's a lot 'softer' than transistors though, and usually isn't as objectionable. Almost all valve amps will develop crossover distortion when the output is driven to hard clipping - this is discussed in the Valves section of the ESP website.
A technique for minimising crossover distortion is to use a small bias current from the output to either supply rail. However, this 'crossover displacement' technique simply moves the 'notch', but it does not eliminate it. The technique may be referred to as 'Class-XD' (for crossover displacement) in some texts. The offset current forces one of the output transistors into Class-A for very low-level signals. It might be possible to move the notch far enough from zero to make measurements look better, but it's a band-aid, and doesn't solve the problem.

| When we look at notch filters, you'll see that even with feedback around the filter circuit, the notch depth is barely affected. This is a very similar phenomenon - when the notch is perfectly tuned, the circuit has no gain, and feedback is unable to restore flat response. From this we can deduce that feedback can only work when the circuit doesn't have (close to) zero gain. This should be self evident, but I've not seen this aspect of feedback and distortion covered elsewhere. |
It's often hard to know what the signal levels of distortion represent in real terms. Sometimes, distortion may be described as a level in dB rather than a percentage. While quoting distortion in dB is not conventional, it actually tells you more about the likely audibility of distortion products than a simple percentage. It's easy enough to convert from one to the other once you know how to do it. Measuring very low distortion levels means that you either have to use a metering circuit that can resolve very low residual voltages, or the input voltage has to be raised to a sufficiently high voltage that you don't have to be able to measure a few microvolts.
| Percentage | 1 Part per ... | dB | Residual |
| 1.0% | 100 | -40 | 10mV |
| 0.316% | 316 | -50 | 3.16mV |
| 0.1% | 1,000 | -60 | 1mV |
| 0.032% | 3,160 | -70 | 316μV |
| 0.01% | 10,000 | -80 | 100μV |
| 0.0032% | 3,160 | -90 | 31.6μV |
| 0.001% | 100,000 | -100 | 10μV |
| 0.0003% | 316,000 | -110 | 3.16μV |
| 0.0001% | 1,000,000 | -120 | 1μV |
| 0.00003% | 3,160,000 | -130 | 316nV |
| 0.00001% | 10,000,000 | -140 | 100nV |
Based on Table 2.3.1, intermediate percentages are easily worked out once you know the base ratios. While it was clearly demonstrated above that we can hear signals well below the noise floor, it stands to reason that if the distortion is at least 60dB down, it's very unlikely that it will be audible. However, that does not mean that 0.1% THD at full power will be maintained at lower levels. An amplifier with crossover distortion (in particular) will show that the distortion increases as the output level is reduced. If you look at any opamp distortion graph (along with many power amplifiers and other electronics), you'll see that the distortion (to be exact, THD plus noise) increases at very low levels. This is almost always not distortion, but residual noise. The figures with a light grey background are of academic interest - anything below 0.001% THD can generally be ignored.
¹ There was an error in the table that's been corrected. All values shown are at 10dB intervals.
Building a metering circuit that can measure 10μV is challenging (a rather serious understatement). Below that, the task becomes even more difficult. Likewise, having a preamp circuit that can boost the input level to a worthwhile degree without adding noise and distortion can be no less challenging. Fortunately, we have opamps available that have vanishingly low distortion and low noise, but the best of them will be expensive. Ideally, the input reference level should not be less than 10V RMS, so instead of trying to measure 10μV we'll have 100μV. However, this is still difficult to achieve. It's no accident that even the best 'old-school' distortion meters have a lower full-scale limit of 0.01% THD+N, as it's possible to build a metering circuit that can measure between 100μV and 1mV without too many compromises. Most have a minimum full-scale reading of 0.1%, and the minimum distortion that can be reliably read on the meter is about 0.02%.
Having an oscilloscope output that lets you see the distortion waveform isn't just 'nice to have', IMO it should be used every time you look at distortion. You'll sometimes see 'artifacts' that are clearly the result of a sharp discontinuity, most commonly this will be remnants of crossover distortion. Even with an oscilloscope, the residual can be extremely hard to see clearly due to noise. For thermal (white) noise, modern scopes have the ability to use averaging, which eliminates most of the noise component and leaves only the distortion waveform.
Other things that can cause havoc include 50/60Hz hum (or 100/120Hz buzz), caused by ground loops (or power supply ripple). This might be from the DUT, but are often as a result of a ground loop created between the oscillator, DUT and distortion measuring system. If you're sure that any hum is the result of an external ground loop, a high-pass filter is often used. A standard frequency is 400Hz, but that is intended for measurements of 1kHz and above. Some analysers also include a low pass filter (typically at 80kHz) to remove excess noise, without seriously impacting the measurement accuracy. An additional 30kHz low-pass filter may be provided on some analysers.
Measuring (and quantifying) distortion is not an easy task. The equipment has to be made to a very high standard for accurate measurements below ~1%, and those requirements get harder to meet as you attempt to measure lower levels. It shouldn't come as a surprise that distortion analysers are expensive, but if you know how to do it, getting reliable measurements down to around 0.02% are within reach for the dedicated DIY constructor.
The notch filter technique is still the most common for distortion meters. Complex (and very expensive) test systems such as those by Audio Precision now perform most of their processing digitally, but this is not an option for anyone who doesn't have a spare US$20k or more to buy one. There are still many notch filter based distortion measuring sets available, both new and second-hand. The Project 52 Distortion Analyser has been on-line since 2000, and it's based on a Twin-T notch filter.
There are many different ways to make a notch filter. All of them rely on phase cancellation at a single frequency to make the fundamental 'disappear', leaving behind the harmonics and noise (including hum or buzz from the power supply). The filters have (theoretically) infinite notch depth, but this is impossible to achieve in reality. The notch is extremely sensitive to any frequency drift from the oscillator, or small changes to capacitance and/ or resistance due to temperature variations. if you have a notch depth of 80dB, the measurement threshold is 0.01%, and the frequency only has to change by perhaps 0.01Hz for the signal amplitude to rise by 6dB. The +3dB bandwidth of the notch is extremely small - less than 0.01Hz (10mHz) depending on the depth (maximum rejection).
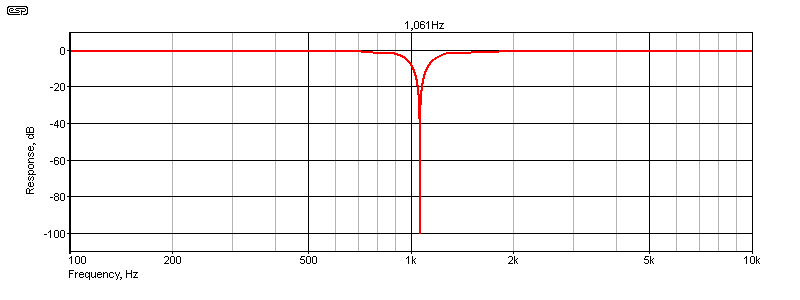
Fig. 3.1 shows the response of a notch filter that can achieve a -100dB reduction of the fundamental frequency. The response is based on a Twin-T filter, and I've used the combination of 15nF capacitors and 10k resistors in most examples, giving a notch frequency of 1.061kHz. The majority of these filters use the 'standard' R/C filter formula ...
f = 1 / ( 2π × R × C )
Some filters make tuning easier than others. Fewer precision tuning components makes it easier to locate the parts necessary, but more (active) electronics may be required to achieve a good result. Compromise is an important part of the design process, and all notch filter topologies have strengths and weaknesses. It's almost always necessary to use opamps in the notch filter circuit, either to make it work at all, or to improve its performance. Notch filters have their own page - see the article Notch Filters for the different types.
Some manufacturers (notably Hewlett Packard) have used variable capacitors in place of variable resistors. These have the advantage of almost zero electrical noise, but capacitor 'tuning gangs' (as used in early radio tuners) have low capacitance, so very high value resistors are necessary for measuring low frequencies, greatly increasing the noise floor due to the high resistance values needed. Stray capacitance also causes problems, but they're not insurmountable.
It is possible to build a notch filter using an inductor and capacitor, but the series resistance of the inductor will seriously limit the notch depth. One variation that can work is to use a NIC (negative impedance converter) based gyrator (see Active Filters Using Gyrators - Characteristics, and Examples). 'Section 11 - Impedance Converters' covers this type of gyrator, and a simulation shows that better than 50dB attenuation is possible. However, this is nowhere near as good as any of the circuits that follow, and tuning isn't simple.
I've shown AC coupling and a series resistor (10Ω) in the Twin-T filter, but these are not included in the others. However, the cap is always necessary to prevent any DC offset from affecting following stages - especially distortion amplifiers and metering circuits. The resistor prevents oscillation if the load is capacitive (shielded cable for example).
Most of the notch filters shown below are capable of a -100dB notch when tuned perfectly. One possible exception is the MFB (multiple feedback) notch, which is limited to about -90dB (opamp dependent to some degree). For some applications this may still be sufficient, but you can't measure distortion below about 0.04% because too much fundamental frequency will get through the notch filter. Conversely, any two notch filters can be used in series, providing close to an infinite notch depth. I leave it to the reader to work out how to measure 1μV without noise swamping any distortion residual. 
The first notch filter to be covered here is the venerable Twin-T (aka parallel tee). It's been a mainstay of distortion meters for a long time, because it's relatively easy to implement for 'spot' frequencies. Once, one could get 30k+30k+15k wirewound pots that made tuning over a decade a fairly simple task. I have one from a distortion meter I built around 30 years ago (perhaps more - I don't recall exactly). These are no longer obtainable, and even when I got mine they were fairly uncommon.
A passive Twin-T notch can achieve -100dB quite easily, but the Q is fairly low, which causes the 2nd and 3rd harmonics to be attenuated. The error is over 8dB for the 2nd harmonic, and about 2.6dB for the 3rd. Most equipment has low levels of even-order distortion, but if one is measuring a valve amplifier, that can be very different. The solution is to add feedback. The feedback cannot eliminate the notch, but it will reduce the maximum depth. It does minimise the response errors for low-order harmonics. The maximum permissible error depends on the designer (it may or may not be specified), but anything over 1dB is unacceptable. It's not difficult to keep the maximum error under 0.25dB while retaining a notch depth of -100dB or more. That allows distortion measurement down to 0.001%. Excellent opamps are needed if that's to be achieved.
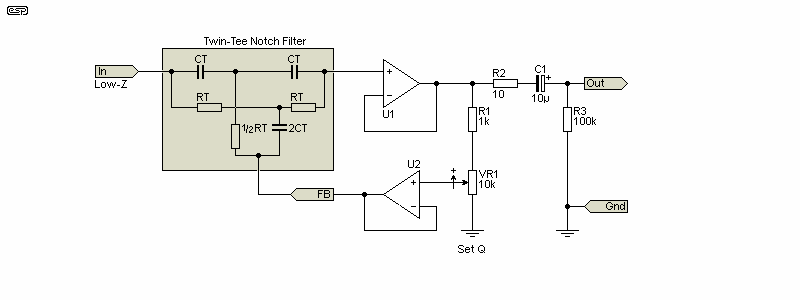
To make tuning easier for manual adjustments, the Q can be made variable. Initial (rough) tuning is done with a low Q, and it's increased as the operator gets close to a complete null. The Twin-T filter should be driven from a low impedance, but it's not particularly sensitive to the source impedance. It's not a good idea to use anything greater than 100Ω, but it's not as critical as some other topologies. The tuning is determined by ...
f = 1 / ( 2π × RT × CT ) (Where CT2 = 2 × CT, ½RT = RT / 2)
The Twin-T has been popular for a long time, because it's so easy to implement. Feedback is provided by followers, so even 'pedestrian' opamps can give good performance. The insertion loss (loss of signal at frequencies other than the notch) is 0dB, and it's fairly easy to trim the resistance to get a very good null. The notch shown in Fig. 1 was derived from a Twin-T circuit. The greatest disadvantage of the Twin-T is that to make it fully variable, you need a 3-gang pot with one gang half the value of the others. You can use a 4-gang pot with two elements in parallel to get the half value, but both options are very limited now.
Note that the Q is shown as variable (VR1) in Fig. 3.1.1, but it's normally fixed. All other notch filters shown use fixed Q. For unity gain buffer feedback systems, a ratio of between 1:8 and 1:10 is usually optimum. For a ratio of 1:8, if VR1 is replaced with a 10k resistor, R1 becomes 1.25k. My preference is to use 1k and 10k, which for most filters results in an error of less than 0.5dB for the second harmonic.
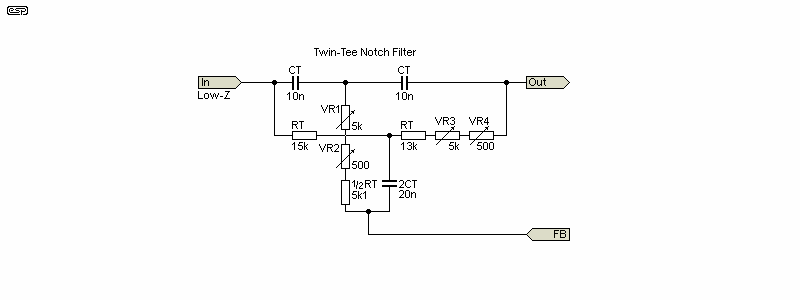
In practice, RT (either one) and ½RT will be a slightly lower value than required, and variable resistors (pots) used in series to allow the notch to be tuned. Most distortion meters that use the Twin-T circuit have two pots in series for each location, with a resistance ratio of ~10:1. If the nominal value for RT is 15k, you'd use perhaps 13k (12k + 1k), with a value for VR3 of 5k, and VR4 as 500Ω. ½RT could be 5.1k, with VR1 a 5k pot. A 500Ω pot (VR2) is used in series for fine control. All pots are very sensitive when you have notch depth of -100dB. Just 1Ω added to RT (either one) will affect both frequency and notch depth.
All notch filters are similarly afflicted.
Bridged-T filters normally have low Q and are more likely to be found in equalisers and other 'mundane' audio circuits. If all values are optimised, the Bridged-T circuit can be used as a deep notch filter. The values of R1 and R2 are critical, with a ratio of 5:1 (10k and 2k as shown). Unlike the Twin-T, the circuit must be driven from a low impedance.
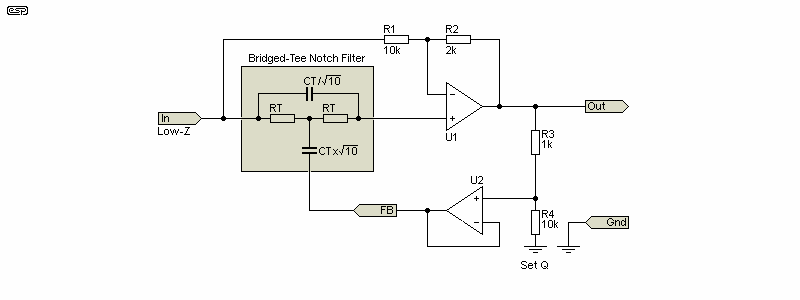
The capacitance values are 'interesting'. The value (CT) is calculated by the standard formula shown above, but the bridging cap is divided by √10 (3.162) and the 'tee' cap is CT multiplied by √10. The net result is that the 'tee' capacitor is 10 times the value of the bridging capacitor, and this produces a good notch. This isn't a common arrangement, but several manufacturers have used it over the years.
If RT is 15k as with the other filters, C x √10 is 31.6nF and C / √10 is 3.16nF. It would be easier to use 47nF and 4.7nF caps and 10k resistors to get a frequency of 1.0708kHz. This gets harder if you can't set the input frequency very accurately.
The Wien bridge has one advantage over the Twin-T in that there are only two tuning elements. This means that a readily available dual-gang pot can be used for tuning, so it's possible (even today) to get suitable tuning pots. While the Wien Bridge is simpler than a Twin-T by itself, the number of support components means that the final filter is quite a bit more complex. The performance is (close to) identical with the values shown.
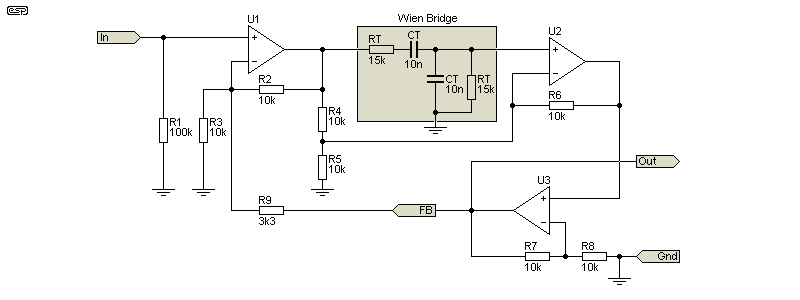
The circuit needs quite a bit of feedback to get flat response down to the 2nd harmonic, and that's controlled by R9. Reducing the value provides little benefit, as the response at 2kHz (for the 1.061kHz fundamental) is less than 1dB down. With 3.3k the pass-band response is close to unity, but that changes if the Q is altered. Wien bridge notch filters always need a gain stage, and it can be easy to cause an overload if you're not careful. The Fig. 3.2.1 version has a gain of 1.6 (x4.1) at the output of U2B, but as that's the output it can't go un-noticed. However, it must be considered when setting the level prior to a THD measurement.
A particular disadvantage of the Wien bridge is its insertion loss. It's typically 10dB, and this has to be compensated by using extra gain. With the extra gain comes noise and an inevitable upper frequency limit that's caused when opamps are used with gain greater than unity. It's not insurmountable, but you have to use much better opamps than expected.
Another disadvantage of all Wien bridge notch filters is that it's not easy to set the reference level. With a Twin-T you simply disconnect the 'tail' or short between input and output, but Wien bridges are trickier. Because they have gain stages, the overall level isn't unity. Variable Q is possible (but it's likely to be difficult). Because the gain changes when the Q is changed, additional compensation would be required. These issues haven't stopped anyone from using the Wien bridge though - everything can be solved with a little ingenuity.
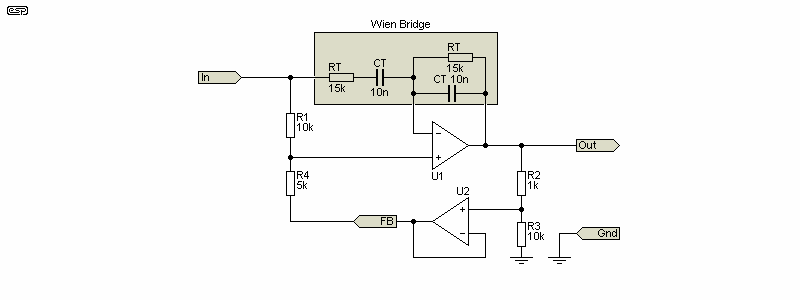
The version shown in Fig. 3.3.2 is the most practical. With no input amplifier to contribute distortion, it's not affected by the source impedance (within reason). This means that an attenuator can be used to measure high levels, while low levels can be amplified after the notch filter. The input level must not exceed the opamp's maximum input voltage limits, and the insertion loss is only 1.5dB. Tests show that an source impedance of even 2.2k has only a minor effect, but you need very good opamps for U1 and U2 to get a good result. Anything below the specs of an NE5532 will be probably be disappointing.
Layout is important with any notch filter, as stray capacitance can play havoc with the tuning frequency. Realistically, R1 and one of the timing resistors (RT) will need a 200Ω multi-turn wirewound in series with each fixed resistor to allow tuning. Tuning caps should ideally be polystyrene, but polypropylene will probably be alright. Polyester has a noticeable temperature coefficient that will cause drift. If you can get a notch depth of 100dB, the bandwidth is measured in milli-Hz, so low drift and a very stable test oscillator are very important.
The (bi-quadratic) state-variable filter is one of the most flexible filters ever designed. It's based on a pair of integrators, but has feedback paths that provide simultaneous low-pass, band-pass and low-pass outputs. If the high-pass and low-pass outputs are summed, a notch filter is obtained. It has variable Q, and can produce a notch depth of at least 100dB with good opamps. There are only two networks that have to be tuned, so dual-gang pots will work for coarse tuning, with series (lower value) pots to get fine-tuning. It's reasonably tolerant of component tolerances, but it requires four opamps for the filter and summing stage. It must be driven from a low impedance source to ensure the desired gain and Q are achieved.
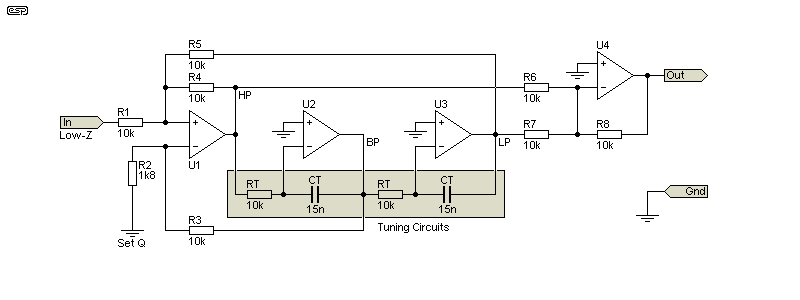
The Q is adjusted by varying R2. With 1.8k as shown, the 2nd harmonic is attenuated by less than 0.5dB. As with other circuits shown, the frequency is changed using RT and CT. When combined with an input buffer the circuit uses five opamps. Ideally, all of them need to be 'premium' devices, with wide bandwidth and low noise. Using 'ordinary' opamps will result in a loss of performance. While the state-variable and 'biquad' (below) filters are both bi-quadratic, they behave very differently.

The other bi-quadratic filter looks like a state-variable, but it's quite different. The filter is commonly called a biquad, and unlike the state variable with low-pass, high-pass and bandpass, the biquad only provides bandpass and low-pass. The biquad comprises a lossy integrator (U1) followed by another 'ideal' integrator (U2) and then an inverter (U3) - the last two can be reversed with no change in performance. This subtle change provides a circuit that behaves differently from the state variable filter. For a biquad, as the frequency is changed, the bandwidth stays constant, meaning that the Q value changes (Q remains constant with a state-variable filter).
I'm not going to describe the tuning formula, as it depends on too many variables. The values shown in the circuit provide a frequency of 715.3Hz, with a notch depth of 70dB as simulated. Because the Q is not constant, the biquad filter is not suitable for a variable-frequency notch filter. Both the state-variable and biquad filters are comparatively insensitive to component tolerance. Of the two, the state-variable is (IMO) a better filter with fewer interdependencies.
A notch filter using phase shift networks (aka all-pass filters) looks superficially similar to the state-variable, but if implemented well it can have higher performance. There are two identical all-pass filter stages (U1 and U2), with U3 summing the phase-shifted and direct signal, as well as providing feedback to prevent the 2nd harmonic from being attenuated. R1 must be fed from a low-impedance source. If the value is reduced, the gain of the circuit is increased, and the Q is reduced.
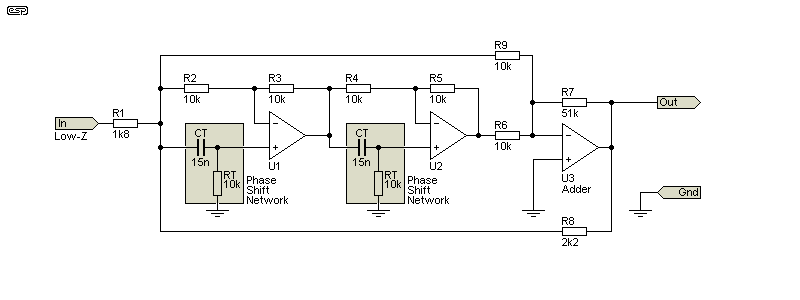
This filter is used in the Sound Technology 1700B distortion analyser, which can measure down to below 0.01% THD full-scale (distortion can be measured as low as 0.002%). Like any filter that uses opamps in the notch filter itself, they must be 'top shelf' devices, with wide bandwidth and very low distortion. The 1700B used Harris Technologies HA2605 and NE5534 opamps in the notch filter. Fine-tuning was achieved using LED/LDR optoisolators, in common with most other auto-nulling distortion meters.
Please Note: There was an error in Fig 3.5.1 that has been corrected. R9 was meant to go to the -ve input of U3 as shown now. I apologise for any confusion this may have caused.
There are other topologies that you may come across apart from those described above. They are far less common and generally don't have a notch depth that's suitable for low distortion measurements. Two that I came across during research into this article are a multiple-feedback band-pass filter with subtraction to provide a notch, and the rather uncommon Fliege notch filter. Neither of these filters can achieve much better than 70dB attenuation, but two can be used in series to get effectively infinite attenuation of the fundamental. I'm not entirely convinced that this is such a great idea, but it does mean that 'pedestrian' opamps can be used while still getting a very good end result. Of course, the same can be done with any of the other filters shown.
Using a pair of notch filters will complicate the tuning process, but can produce a notch depth of close to 200dB. Anyone who thinks that measuring less than 10μV distortion residual is even possible probably needs to brush up on the noise contribution of every component in the circuit. Tuning will also be a nightmare, as the bandwidth of the notch is incredibly narrow. At maximum notch depth, the frequency has to be within ~20mHz (that's milli-Hertz, or 0.02Hz!). The tiniest amount of drift from the oscillator or tuning components (caps and resistors) will reduce the notch depth substantially.
No commercial distortion analyser has ever attempted to measure distortion at such high resolution, and very expensive equipment (e.g. Audio Precision) is needed to even attempt such measurements. These invariably measure the spectrum, not a 'simple' THD+N measurement. That's not to say it can't be done, but I certainly wouldn't bother. A simpler method is to use a decent notch filter to remove most of the fundamental, then use PC spectrum analysis software to look at the residual signal and its harmonics. With 16-bit resolution, most PC sound cards will actually do a fairly decent job. This idea has been published as Project 232, and it can rival the expensive kit - at least for distortion measurements.
The first 'miscellaneous' design shown is based on a Fliege notch filter. This is not a common topology, but it is reasonably economical. With particularly good opamps it can achieve a notch depth of -90dB or more, but the value of R1 and R2 is critical. They must be identical to get a good notch, so one of them should be reduced and a trimpot added in series to obtain a way to adjust them. Even a mismatch of just 10Ω will cause the notch depth to be reduced dramatically.
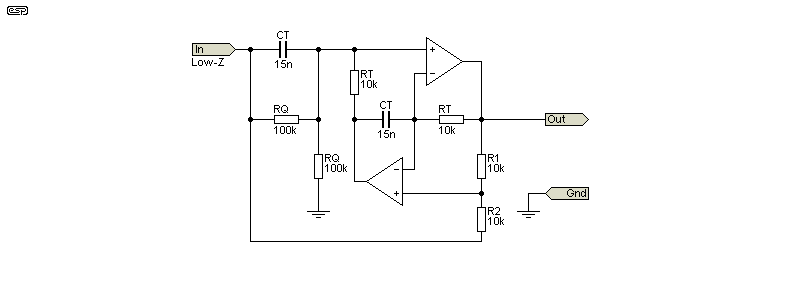
The Fliege filter is one example of several that use a negative impedance converter (NIC). This typically (but not always) 'synthesises' an ideal inductor as part of the tuned circuit. The performance can be very good, but you must treat any circuit that uses negative impedance with caution. A seemingly minor resistance variation may cause oscillation.
The second alternative is a multiple-feedback (MFB) bandpass filter, with a summing amplifier to mix the input voltage with the filter's output. This can achieve a deep notch with no significant attenuation of the 2nd harmonic. The notch depth is acceptable, with a reasonable expectation of better than 70dB. The values needed for a 1kHz notch are different from all the other circuits, because of the way an MFB filter works.
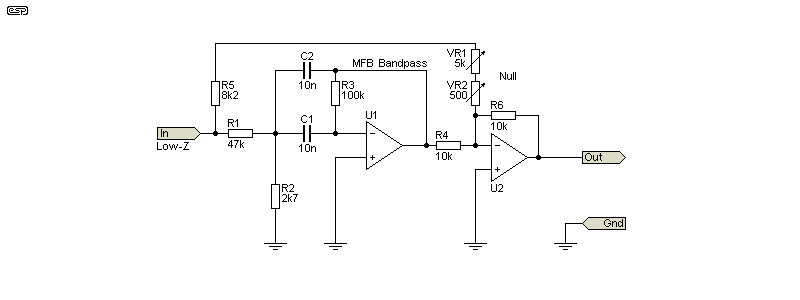
With the values shown, the frequency is 996Hz, assuming exact values for the resistors and capacitors. It will almost certainly be necessary to tweak one or more values to get the frequency you need. The tuning range is limited, and if the frequency is changed it may not be possible to get a deep enough null. The input frequency (from a suitable sinewave generator) forms part of the nulling process, and that can make accurate readings very difficult.
The optimum null is achieved when the currents through R4 and the series connection of R5, VR1 and VR2 are exactly equal with an input signal at exactly the frequency of the tuned circuit (the MFB filter). With the values shown, the frequency is 996.018Hz, the gain is 1.063 and Q is 3.127, based on the calculations below.
The formulae are somewhat daunting for these filters, as everything depends on everything else. The gain, frequency and Q are interdependent, so calculations are not straightforward. To start, you need to know the gain, frequency, Q and decide on a suitable capacitance. From these, you can calculate the three resistors that determine the circuit's performance. An easy way to work out the values is to use the ESP MFB Filter Calculator.
R1 = Q / (G × 2π × f × C)
R2 = Q / (( 2 × Q² - G ) × 2π × f × C )
R3 = Q / ( π × f × C )
f = 1 / ( 2π × C )) × √(( R1 + R2 ) / ( R1 × R2 × R3 )) (Sanity check)
Based on these formulae, the optimum values are R1 = 47.75k, R2 = 2.808k and R3 = 95.49k. The values used change the frequency very slightly, and at 996Hz the error is less than 1%. The input frequency needs to be set so it's right at the tuning frequency. The null control is very sensitive, and will require two pots in series, with a resistance difference of ~10:1. If R5 is 8.2k, you'd typically use a 5k pot with a 500Ω pot in series. Based only on a simulation using TL072 opamps, the notch depth can reach about 76dB, although this is might not be achievable in reality.
There's no easy way to change the frequency without it affecting the gain and Q of the filter. Making R3 part-fixed, part-variable (e.g. 82k + 50k and 5k pots) will allow a small frequency change, but because that also changes the gain it will interact with VR1 and VR2. Control interaction is common with all notch filters though, so that's not a serious limitation.
The MFB version shown above isn't the only option. Any high-Q bandpass filter can be used, and the output from the filter can be summed (or differenced) by an opamp stage to get a reasonably good null. Ultimately, it all depends on how much circuit complexity you're willing to accommodate, whilst understanding that this approach will rarely get a null of better than -70dB. If the output of the notch filter is used as an input to a spectrum analyser (e.g. suitable PC software that provides FFT capability), then even a 40dB notch is still capable of giving very high resolution.
One filter that lends itself well is described in Project 218. The filter circuit is also shown below, in Fig. 8.1 (only one filter is required). The circuit is easily tuned over a reasonable range, while being able to reduce the fundamental by at least 40dB. This is sufficient to allow high resolution FFT analysis even with a basic sound card and suitable PC software. However, most FFT analysers have a dynamic range that means that a notch filter is probably redundant (and it needs more circuitry and adjustment to take a measurement).
One distortion meter (Meguro MAK-6571C) that I've used for some time is based on LC (inductor-capacitor) filters. The filter banks are quite complex, and there's one for 400Hz and another for 1kHz. There is no tuning function, and the filters are designed as high-pass. There is no notch, so the filters have to be particularly sharp cut-off. Any hum or low-frequency noise is naturally excluded. There are a couple of other meters that I suspect use the same technique, and it seems likely that they are clones of the MAK-6571C.
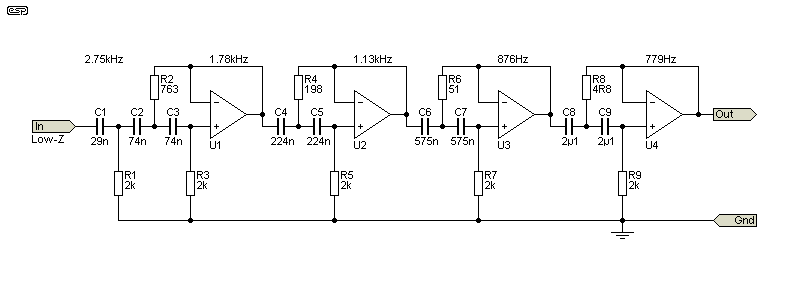
The meter I have always seems to give fairly representative results, so this scheme certainly works (within its limitations). To be fully effective, the filters need a slope of at least 50dB/ octave. This can be done with opamps as shown above, and the filter shown is 80dB down at 400Hz (0.01% THD). A simplified design (produced by the Texas Instruments 'FilterPro' software) is shown, and while it certainly works, it's an uncommon way to measure distortion. All such filters need odd-value resistors and capacitors, and are very sensitive to component tolerances. The level at 400Hz is at -80dB, and response is passably flat (±3dB) at and above 800Hz (the second harmonic). This isn't a recommended method due to the difficulty of construction.
Other filter topologies can also be used, which may simplify (or complicate) the circuit. Design will never be easy with a 9 or 10-pole filter (54dB/ 60dB/ octave nominal respectively), but a multiple-feedback filter will use more parts overall than the Sallen-Key filters shown.
Not all distortion meters include filters, but 400Hz and 80kHz filters are provided on some so that noise can be removed from the signal without materially affecting the distortion reading. Hum (mains and/ or rectified AC buzz) can be (mostly) removed with the 400Hz filter, which may be cheating unless the hum is due to ground loops in the measurement setup (i.e. not from the DUT). Some instruments use a differential input to minimise ground loops, but mains hum can still get through in some cases. There's rarely a good reason to measure beyond 80kHz (the 4th harmonic of 20kHz), and the reduction of noise (especially that from the measurement system itself) makes it easier to see distortion residuals that may otherwise not be visible.
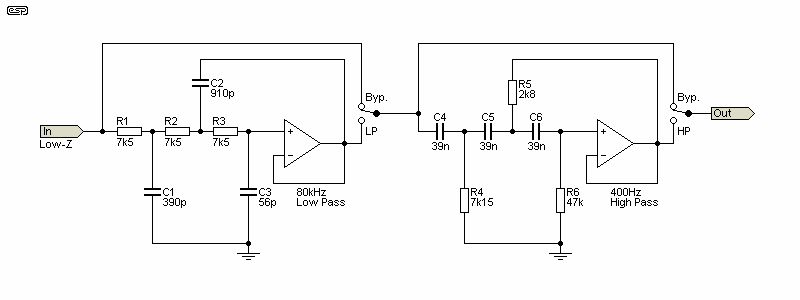
The filters are usually 18dB/ octave (3-pole), and are usually 'traditional' Sallen-Key types. The examples shown provide the response needed, and they would normally be equipped with the facility to bypass the filter(s) that aren't required. Whether these are in the distortion output circuit or before the metering amplifier depends on the design. In most cases they will be before the metering amplifier and the distortion output.
The 400Hz filter will suppress mains hum (50Hz) by 55dB, or 50dB with 60Hz. As always, the filter frequency is a compromise, and while better low-frequency attenuation is possible with a steeper filter, that adds more parts, and isn't (or shouldn't be) necessary. Some instruments include a 30kHz low-pass filter as well, which is used primarily for testing and verifying broadcast equipment.
Most distortion meters use average metering, calibrated for RMS. There are a small few that use 'true-RMS' meters, which are more accurate, and the results of a test on a given piece of equipment will be different depending on the metering system used. The average value of a rectified sinewave is 0.637 of the peak value, while RMS is 0.707 of the peak. Average reading meters may be calibrated to show RMS, but that works only with a sinewave. Other waveforms (particularly distortion residuals) will have errors, and the amount of error depends on the waveshape. The discrepancy can be extreme, with some waveforms able to produce an error of almost 90%. You will encounter that if you're measuring crossover distortion, and there is always a difference between true RMS and average reading, and what you see on a scope.
Some meter rectifiers measure the peak, and calibrate that to RMS. A 1V peak sinewave will be scaled to 0.707 so again, it looks like the RMS value. Again, this creates serious errors with some waveforms. All meter rectifiers are full-wave. Half-wave rectifiers will create large errors with asymmetrical waveforms. It's not an option, and I know of no test instrument that uses a half-wave meter rectifier. I also know of no distortion meters that use a peak-reading meter amplifier.
In the early days of transistor/ 'solid state' circuits, many meter amplifier/ rectifiers were made using discrete parts. No early opamps were good enough, and a discrete design would have wider bandwidth and lower noise than opamps of the day. We're spoiled for choice now, but very low noise opamps are still expensive. One of the best is the AD797, but it comes at a cost (around AU$33.00 at the time of writing). There are cheaper ways to get low noise. To ease the burden on the metering amp (U1B), a preamp should be used to increase the signal level first. The meter circuit shown has a sensitivity of 5mV using a 100μA meter movement. The two opamps need to be high-speed types to get good high frequency response.
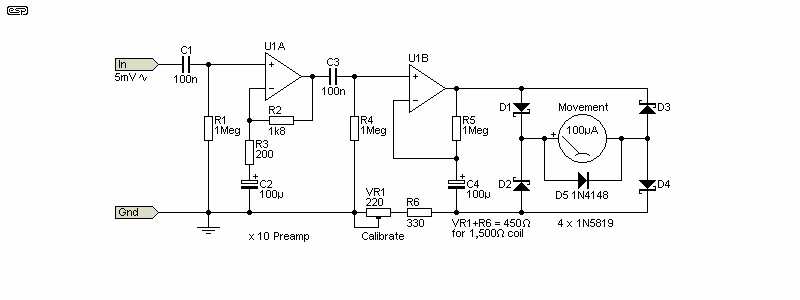
The meter amp shown is more-or-less 'typical', and it's average reading due to the meter movement itself. The rectified output isn't smoothed or filtered, so the pointer always responds to the average of the rectified waveform. This can be a problem at very low frequencies, because the meter almost certainly won't have enough electromechanical damping to prevent the pointer from responding to signals of less than 5Hz (effectively 10Hz due to full-wave rectification). Meter amplifiers are covered in some detail in AN002 (Analogue Meter Amplifiers).
The diodes are particularly important. In an ideal case they'd be germanium because of their lower conduction voltage. When the diodes aren't conducting, the opamp is operating close to open-loop, and the output has to swing across the diode voltage drops (0.7V with silicon diodes). This imposes an upper frequency limit based on the opamp's slew rate. U1 has to be as fast as possible, and the slew rate should be at least 20V/μs. The opamp doesn't necessarily have to be very low noise, as it's easier to include a preamplifier to get the required sensitivity. It's not immediately obvious, but the metering amp has the same constraints as the Fig. 2.1.1 (A) amplifier - there is no feedback until the diodes conduct. There's no option to apply bias, as that would show as a meter reading. A linear wide-band metering amplifier is a much greater challenge than it first appears.
Note the diode in parallel with the meter movement. It's used to limit the maximum current through the meter, as the opamp can deliver far more current than a high-sensitivity movement can handle safely. This diode must be a 'standard' silicon type, such as 1N4148 or similar.
This is just one example, and there are many different approaches taken by various manufacturers. The version shown is not one that I've used in any projects I've built, but it's well behaved at audio frequencies. Don't expect to get above ~50kHz before rolloff becomes apparent. In some cases, it may be necessary to use an offset balance control to ensure that positive and negative peaks are exactly even. Some distortion meters have used digital displays, but in general they are not as user-friendly as an 'old-fashioned' analogue meter movement.
No common metering amplifiers have particularly high gain because their primary function is to drive the meter movement. If you use two opamp gain stages (two of the stages shown in Fig. 5.1), each with a gain of 10, it's not difficult to get flat response to well over 200kHz, but the opamps all need to be very fast. The common TL072 is not good enough, and even a 3-stage meter amp will struggle to get to 100kHz driving a 100μA movement. You need opamps with a unity gain bandwidth of at least 12MHz. You might expect better with something equivalent to an LM4562 (55MHz, ±25V/μs), but tests I've performed show that it's not fast enough. Reasonably low noise is also a requirement, since you need to be able to get full-scale with no more than 5mV RMS input. If you're trying to measure down to 0.001% THD, you only have a residual signal of 10μV with a 1V RMS input.
To be able to measure 0.01% THD with a 1V input, the meter circuit needs an input sensitivity of 100μV, so even with a 3-stage meter amp with 5mV full-scale sensitivity, additional gain is required. Even 0.1% full-scale requires 1mV sensitivity for a 1V input. The challenges are fairly obvious, especially since the required gain and bandwidth far exceed the requirements for audio reproduction. Most distortion meters have several gain stages before the metering amp, especially if distortion below 0.1% is to be measured. Note that the metering amps do not need to be particularly low distortion, as their only job is to amplify the residual distortion signal. If they add a little distortion to the residual it's usually of little consequence. I'd consider anything up to 1% to be quite acceptable, and a simple discrete meter amp is often preferable to using an opamp. The higher the sensitivity of the meter movement, the easier it is to drive, so if you have a choice, use a 50μA or 100μA movement rather than 1mA.
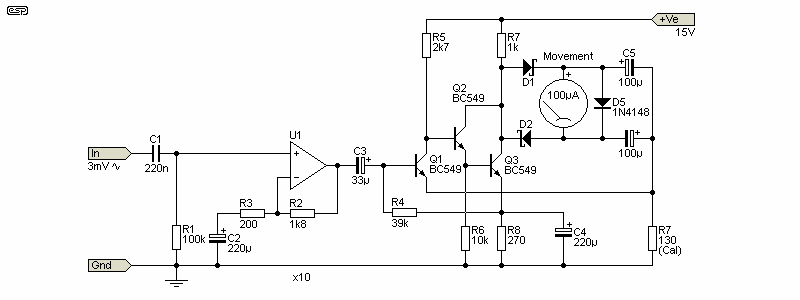
The simple meter amplifier in Fig 5.2 uses just three cheap transistors, but can provide 100μA at up to 100kHz. With the x10 opamp circuit in front, the full-scale sensitivity is only 3mV. Calibration is done by changing R7 (it should be a trimpot). It's difficult to beat this even with a very good IC opamp. The version shown isn't optimised, and it can be improved by reducing the gain of the meter amp (thereby providing more feedback), and adding the necessary gain externally. The opamp will be the limiting factor for frequencies over 100kHz. Sometimes a discrete circuit is the best choice, although it might not seem like it at first. Simple circuits like that shown may not be particularly linear though, and are unlikely to provide good accuracy at low input voltages (e.g. 10% of full scale). According to the simulator, the Fig. 5.2 circuit reads low by about 0.65dB at 10% of full scale (300μV input). Making the whole circuit sensitive to 10mV (rather than 3mV) improves linearity somewhat.
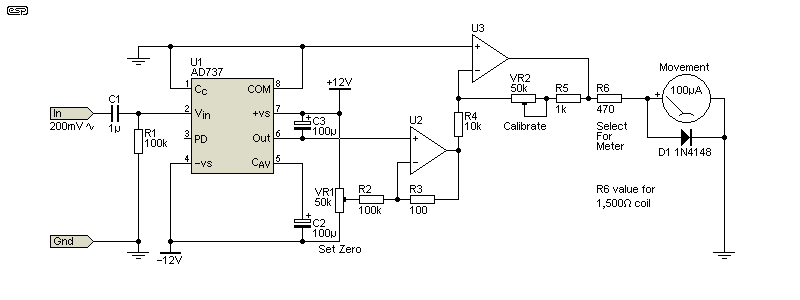
If you'd rather use a true RMS meter, Project 140 shows the complete details, and a suitable example is shown in Fig. 5.3. The AD737 True RMS-to-DC Converter is not a cheap IC, but it will handle most waveforms well, and it's said to be accurate to ±0.3% of the reading. The full-scale sensitivity is 200mV, so an input preamp will be necessary to allow measurement of lower voltages. The metering section should ideally have a full scale sensitivity of no more than 5mV, so an external gain of 40 is required (ideally provided by two stages to obtain wide bandwidth). Alternatively, you could use the Project 231 discrete opamp, which can provide a gain of 100 (40dB) to over 1MHz.
While you may be tempted to use a digital multimeter as the 'readout', be aware that most have poor high frequency response. True RMS meters are likely to be better, but trying to measure less than 1mV with response to (at least) 50kHz is beyond the ability of most digital meters. I've tested my meters and found some of them to respond to no more than about 5kHz, but many are worse. A cheap (non RMS) meter will likely struggle to get beyond 2kHz before the response falls to an unusable degree.
There are several ways to measure intermodulation distortion (IMD), with the most common now being spectrum analysis with specialised equipment. All IMD tests involve the use of two signals, with varying standards used. The 'traditional' way to measure IMD is to use the SMPTE (Society of Motion Picture & Television Engineers) standard RP120-1994 method, which uses a 60Hz signal and a 7kHz signal, with the ratio normally 4:1 (60Hz and 7kHz respectively). When these tones are provided to an amplifier (or other device), the presence of IMD will cause amplitude modulation (AM) of the high-frequency signal. To measure the amount of AM, the low frequency is filtered out with a steep-slope high-pass filter, the modulated 7kHz 'carrier' signal is rectified (in the same way as is done in an AM broadcast receiver), and the high frequency is then filtered out with a high-slope low-pass filter. The recovered signal is a direct representation of the amount of IMD. It's a distorted 60Hz tone that can only be present if there is intermodulation distortion. A completely linear circuit will have zero output, or perhaps a few nanovolts at most, mainly due to imperfect filters.
By measuring the amount of the recovered AM signal, the amount of intermodulation is revealed. In most cases, an amplifier with low THD will also have low IMD, since the process of amplitude modulation requires non-linearity in the amplifier. If it has low THD, then (by definition) it has high linearity. However, there's no direct correlation between the two forms of distortion. IMD is without doubt the most objectionable form of distortion, because many of the frequencies produced are not harmonically related to the input signal.
One technique that might work is to look for sum and difference frequencies, and that test might use a 10kHz signal along with an 11kHz signal. IMD would be revealed by looking for a 1kHz signal, which is the difference between the two input signals. However, as noted in the article Intermodulation - Something 'New' To Ponder, if the DUT has purely symmetrical distortion, sum and difference frequencies are not generated. The generation of these frequencies can only occur if the distortion is asymmetrical. In most modern amplifiers and preamplifiers (excluding most valve-based designs), the distortion is symmetrical, so sum and difference frequencies are not generated. AM is produced regardless of the symmetry (or otherwise) of the distortion.
The 60Hz/ 7kHz test method requires two oscillators, preferably with less than 1% distortion. The signals are mixed in the desired ratio (most commonly 4:1 respectively) and fed to the DUT. A loop-back test should be used to ensure that the meter is working, and in the absence of non-linearity the meter should read zero. Anything in the DUT that causes amplitude modulation will be measured, so if a valve amplifier has excessive HT hum that will register as well (excess hum can [and does] often cause amplitude modulation). This can be verified by turning off the 60Hz tone, something that should be allowed for in the oscillators used. Commercial test sets have the ability to turn either tone on and off as needed, or adjust the relative levels.
There's rather a lot of circuitry needed to measure IMD, so rather than detailed schematics, the process will only be shown as a block diagram. The way the filters are implemented is immaterial, provided they eliminate the 7kHz 'carrier' frequency, the original 60Hz modulation signal, and leave only the decoded AM as a residual. The circuits involved aren't especially difficult to realise with opamps, but the AM detector has to have high linearity. Fortunately this isn't particularly difficult, because we're working with audio frequencies and not RF (as with an AM broadcast receiver). Despite any reservations you may have, the AM detector (which is a rectifier) only needs to be half-wave, and a standard 'precision rectifier' using an opamp is all that's necessary. There is a bit of trickery needed to ensure high gain at high frequencies (7kHz) but that's not especially difficult, even with many early opamps.

The diagram above shows the filters and rectifier, and includes the distortion generator circuit. The ratio of the generator's impedance and R1 is such that the harmonic distortion is around 0.038% with just the 60Hz signal. The sum of the 60Hz and 7kHz input voltages is 1.455V RMS, and the output of the IMD measurement system is 1.7mV RMS. This equates to an IMD of 0.116% when both diodes are used. With one diode (even-order), the IMD rises to 0.235% (3.42mV). While these results were simulated, I'd expect the simulation to be very close to reality, and should be easily replicated with any simulator.
The subject of IMD is covered in depth in the article Intermodulation Distortion (IMD). This covers just about everything you need to know about the subject, but doesn't go into great detail about exactly how it's measured. With just the block diagram, you can devise the basic circuitry without too much difficulty. As an alternative to a 7th-order high-pass filter, you can use a basic Twin-T notch filter (without any feedback) to remove most of the 60Hz component from the modulated 7kHz carrier frequency. However, the 'residual' of the 60Hz signal will have high output at 120Hz, which makes a notch filter far less effective. You can follow the notch filter with a basic 3rd-order filter, saving a couple of opamps and quite a few resistors and capacitors.
Likewise, the low-pass filter can be simplified by using a 7kHz Twin-T filter (also without feedback) and a simpler low-pass filter. There's still a possible issue with the 2nd harmonic of the 7kHz signal, but it's not hard to get a residual of less than 12μV when there's no distortion. Ultimately, the actual method used doesn't matter, provided that only the amplitude modulated part of the waveform is passed through to the metering circuits, and the gain of the filters and AM detector are maintained at unity.
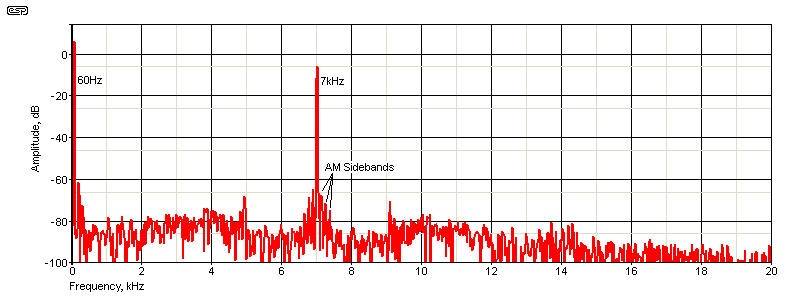
In the above (simulated) spectrum, you can see the sidebands around the 7kHz signal. This is from the input waveform, which looks just fine with no visible distortion, but quite obviously all is not well. The 60Hz sinewave by itself has a THD of 0.038%, which doesn't seem too bad. IMD measurements are described above (0.116% [odd-order], 0.235% [even-order]) using a simulated version of the Fig. 6.1 block diagram. One thing that's important to understand is that even-order distortion does not provide only even-order harmonics or intermodulation products. Odd-order harmonics (and IMD) are also generated, so the idea of 'nice' even-order distortion is a mathematical impossibility. There are a (small) few 'demonstration' circuits that produce only the second harmonic, but these generally don't apply to real circuits.
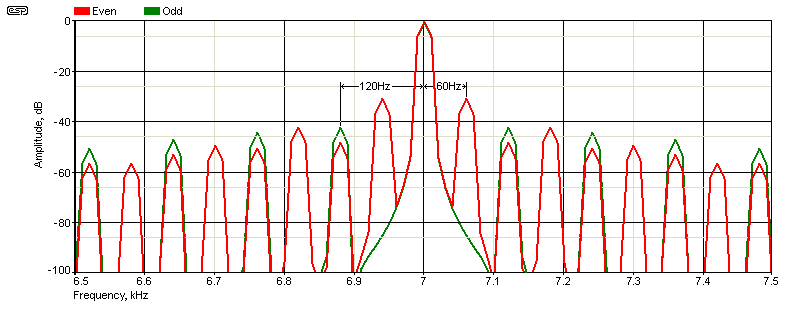
The capture shown above is from the simulator, and shows intermodulation of the standard 60Hz waveform added to a 7kHz 'carrier' (4:1 ratio). This shows clearly that even-order intermodulation creates more sidebands than odd-order. With even-order, the sidebands are spaced at 60Hz intervals, and that's extended to 120Hz with odd-order. The first set of even-order sidebands is only 31dB below the fundamental of 7kHz, vs. 41dB for the first set of odd-order sidebands. The distortion circuit adds 0.62% THD to the 60Hz signal alone (even-order) and 1.9% THD for odd-order.
This shows (yet again) that even-order distortion is not the 'holy grail' of audio. Even with far less THD, the even-order spectrum is not only a greater amplitude, but it's more cluttered, with sidebands spaced at 60Hz intervals vs. 120Hz intervals. Even-order distortion also creates odd-order harmonics and sidebands to the spectrum, and the common claim that it's 'musical' or 'benign' must be viewed with some suspicion. However, the context also has to be considered, and in this case it's based on a circuit that deliberately introduces distortion, rather than looking at a specific device (valve [vacuum tube], bipolar junction transistor, JFET or MOSFET).
How these devices are used in a real circuit is an important factor, so a simple test such as that described here cannot (and must not) be used as the final arbiter of 'audio quality'. It's generally considered that low-order distortion products (typically less than the 5th) are less objectionable than higher order products (5th and above). However this depends on the level, and anything below -120dB is purely academic.
Despite everything that should indicate otherwise, there is no doubt at all that a small amount of primarily even-order harmonic distortion can sound 'nice' for some listeners. My preference is for distortion to be below audible limits, but it's often a personal choice. My main gripe with those who proclaim that their system (distorting) sounds 'better' than those with no audible distortion is that they proclaim this to be a fact, when it's quite clearly an opinion. The two are not the same!
While this form of distortion (aka SID - slew-induced distortion) has largely been shown to be bollocks, you can test for it if that makes you happy. It was a rather hot topic back in the late 1970s and early 80s, but it's not brought up very often any more. The general idea was to inject a filtered squarewave and a low-level sinewave simultaneously into an amplifier, and see how much of the sinewave went 'missing' because the amp's slew rate was (supposedly) too low. There is absolutely no doubt that the technique described works, however, the effective slew rate (voltage change over time) of a squarewave is far greater than any musical instrument can attain. There's more info on this topic in the Intermodulation Distortion (IMD) article.
It was claimed in one of the original articles that a power amplifier had to be capable of a slew rate of 100V/μs to avoid the alleged 'problems'. There's an issue with this, in that an amplifier delivering a 35V peak output at 20kHz only needs a slew rate of about 4.4V/μs - assuming that full power is required at 20kHz with normal programme material. This is quite clearly never the case, and an amp will normally deliver (much) less than 10% of the full output voltage at frequencies above ~15kHz. For a 35V peak output, that means around 3.5V peak (less than 800mW into 8Ω) at 20kHz. The slew rate for that is less than 0.5V/μs. If we allow a safety margin of 10, that's 5V/μs. These figures are all conservative - in reality the levels and slew rate requirements will be lower. That doesn't mean it's not important, but the original claims were wildly exaggerated.
There is no argument that slew rate limiting will cause problems. It can, but with modern semiconductor devices and sensible topologies, it's not possible for any music signal to push a competent amplifier into slew rate limiting. All amplifiers have a limit, but trying to extend the maximum rate-of-change to silly extremes means that you have an amp that's liable to be marginally stable. Ultimately, trying to eliminate TIM by increasing the slew rate of the amplifier is a fool's errand. It's easy in a simulator because we have access to 'ideal' amplifiers, filters and signal sources. None of these is available in the real world, but real world music doesn't need them. Problem solved. 
I don't intend to provide much additional detail here. Most people realised fairly quickly that the idea of TIM/TID was perfectly true, but it very rarely caused any audible degradation. There are still a few folk who insist that there's a problem, and they generally fall into the same category as people who claim they can hear a difference between mains cables (for example). As described above, we can measure down to -100dB fairly easily, and many modern 'top-shelf' measurement systems can get down to below -120dB. Any claim that we can hear things that cannot be measured is simply untrue, and in reality the reverse is the case. It's easy to measure 'stuff' that's completely inaudible, for example the difference between two opamps (all other things being equal) where one has 0.001% THD and another has 0.0003%.
There's never been a universally accepted test method for TIM, and while I've experimented with the idea (with some success), it's largely irrelevant and won't be covered any further here. There's a lot of info on the Net (of course), but not all of it is useful. One thing that will reduce TIM (if you still believe it to be an issue) is to add a low-pass filter in front of the power amp. A rolloff of ~18dB/ octave with a -3dB frequency of perhaps 30kHz should do nicely. It won't affect the audio because there's little or no signal at 30kHz, and even if some signal is present, we can't hear it. A 10kHz, 40V peak squarewave (40V RMS) has a slew rate of ~6V/μs after it's been through a 30kHz 3rd order Butterworth filter (< -0.4dB at 20kHz). Such a signal will never occur with music.
For the adventurous, you can make a filter that lets you see the amplitude of harmonics. Using the filter described in Project 218, it's not especially difficult to make a filter that isolates an individual harmonic, with the next harmonic attenuated by at least 60dB. You can just use a single tuned filter, but performance is greatly improved with two as shown. The values for CR, RT and CT are correct for 1kHz. It's essentially an LC tuned filter, with U1 and U2 forming the first gyrator (simulated inductor). The second gyrator is identical.
The gyrator shown is one of the very few that can achieve extremely high Q. You could use a pair of multiple feedback (MFB) bandpass filters, but tuning them accurately will be almost impossible. I selected this circuit because I know how well it works. Unlike most 'ordinary' gyrators, this version cannot be configured for series resonance, so it can't create a notch filter. You could (of course) use 'real' inductors, but the Q will be far lower and the cost considerably greater. Accurate tuning will be somewhere between difficult and impossible.
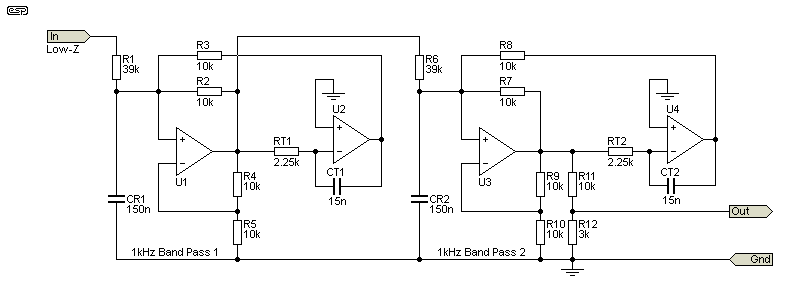
As simulated, resonance is 1kHz, and each gyrator has a gain of two. R11 and R12 reduce that to unity, so there is no overall gain. The amplitude of the harmonic is the actual value. If you use a 333.33Hz input, 1kHz is the 3rd harmonic, or it's the 2nd harmonic of 500Hz. The input frequency has to be exact, so you need to be able to adjust it very accurately. While it's possible to make the filter tunable, that comes with some difficulty. RT1 & RT2 can be made variable over a small range, but you'd need a 10-turn pot to set the frequency accurately.
L = RT × CT × ( ½ R3 )
L = 10k × 15n × 5k = 168.75mH
Frequency is determined by ...
f = 1 / ( 2π × √( L × CR ))
f = 1 / ( 2π × √( 168.75m × 150nF )) = 1 kHz
I tested this with a single filter stage, and it works better than I expected. However, don't expect to be able to see worthwhile results with THD levels much below 1%. From Table 1, we know that means the distortion is 40dB below the signal level, so with 1V input you'll see less than 10mV of the harmonic. Unless you use a number of these filters all tuned to exact harmonics of the input signal, it tells you far less about the distortion characteristics than a notch filter. Early commercial 'wave analysers' (aka frequency-selective wave analysers or frequency selective voltmeters) used a sweep filter and sometimes a CRT (cathode-ray tube) to display the amplitude of each harmonic. Modern instruments use fast Fourier transform (FFT) to display the amplitude of each harmonic in more-or-less 'real time'.
Although the 'simple' filter shown above works, selective voltmeters are very different beasts. They use a mixer stage to convert the incoming audio signal to an intermediate RF (radio frequency), and that's where the narrow-band filters are implemented. Since all input frequencies are manipulated so they have the same frequency, selectivity is easy to achieve. A tunable RF oscillator provides the necessary offset to allow the input frequency to be converted to the IF (intermediate frequency). The IF amplifier has very high selectivity, typically down to ~25Hz. The ultimate selectivity determines the minimum frequency that can be measured.
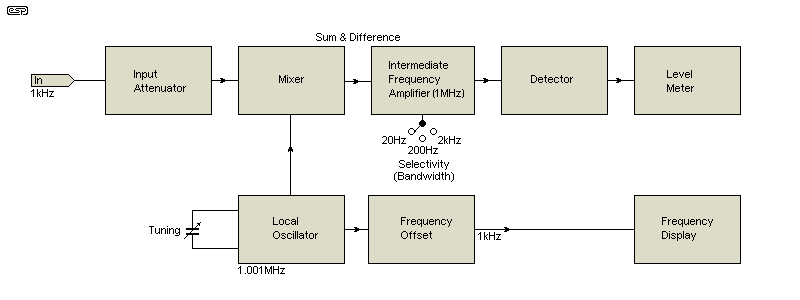
These are complex instruments, and the (highly simplified) block diagram doesn't quite do justice to the real thing. It's neither appropriate nor possible to show more detail, and it's safe to say that however desirable a selective voltmeter may be, they are now well and truly obsolete. The complexity was such that regular maintenance and calibration were necessary, and both were fairly major undertakings. The manual for the HP 312 extends to 160 pages. Many had provision for SSB (single-sideband) and AM detection, allowing them to be used as very 'high-tech' communications receivers.
Wave analysers, frequency-selective voltmeters and other similar instruments were very expensive when they were available, and modern equivalents are no less so. To get the selectivity necessary to isolate each harmonic is always going to be expensive. If it's done digitally, the DSP (digital signal processing) involved is very demanding. 16-bit resolution is good enough for measurements down to about -100dB. One example of a selective voltmeter (and possibly the best known) is the Hewlett Packard 3586B Selective Level Meter. These command a premium price even today, and they cost around US$12,000 when new in ca. 1992. With a range from 50Hz to 32.5MHz, they were largely used for RF and multiplexed telecommunications analysis. The voltage at the selected frequency is displayed on a digital readout or analogue meter, so the level of each harmonic has to be written down and the final level calculated using the formula shown in Section 2.
When the harmonics are located by this method, noise is excluded from the measurement because the filters are narrow-band. This lets you see harmonics that are below the noise floor, although their significance is unlikely to be of much interest. Anything at -90dB or less is almost certainly going to be inaudible.
There are quite a few USB oscilloscope units that are used with a PC, and they offer fairly advanced FFT capabilities. Many of these are better than you might expect, but they usually aren't cheap. There's the requirement for a PC to control the unit and display the output, which means they are less convenient than a stand-alone oscilloscope. Many of the 'latest and greatest' audio analysers require a PC as well, and measurements are often a mixture of analogue and digital techniques.
The most common distortion measurement approach now is spectrum analysis. There are countless PC based software packages that provide FFT capabilities, usually with an oscilloscope interface as part of the package. To get good results you need a good sound card, but even those generally provided on the PC motherboard can work surprisingly well. The greatest limitation is the bandwidth, which is almost always limited to 20kHz. This is adequate, but there may be issues beyond 20kHz that affect the sound but can't be seen when using 44.1kHz sampling. 16-bit resolution also limits the noise floor, but it's still good enough to be able to detect harmonics at -100dBV.
There are quite a few external (USB) audio interfaces (you can't really call them 'sound cards') that offer up to 192kHz sampling and 24-bit resolution. How well (or otherwise) these interface with the various FFT software packages is not known. Some are fairly expensive, and they offer many functions that will not be used if you need a measurement system. They are available from the usual manufacturers, such as Focusrite, Sound Blaster, PreSonus, Behringer, etc. Of the 'better' interfaces, I can't comment on anything other than the Focusrite 2i2, as I don't own a multiplicity of expensive audio interfaces. There's no point discussing any PC's internal sound card, because there are so many differences. Using an audio interface and FFT software, there's no need for a notch filter because the dynamic range is already more than good enough to see harmonics.
The Focusrite 2i2 is a high performance audio interface, but (like internal sound cards) it's not designed to be a measurement tool. As a result, the input impedance is not ideal for measurement applications. The line inputs have an claimed input impedance of 60k, with a distortion of less than 0.002%. The 2i2 supports most sample rates (including 192kHz) and up to 24-bit resolution. This is not a cheap interface, but it still costs far less than a dedicated audio measurement system. If it's going to be used for measurements, I suggest an external panel with BNC connectors. This will let you use 1:1 scope probes, particularly for inputs (phone jacks are decidedly sub-optimal IMO). I've also tested a Behringer UCA222 - it's not as good as the Focusrite, but it can still give good results.
This idea will be expanded shortly, as I plan to produce a project for high-resolution distortion measurement. A link to the project will be placed here when it's ready. The idea is to make it easy to use and flexible enough to get good results with free software. One that can't be ignored is REW (room EQ Wizard see the REW Website). We'll ignore the conventional use for REW, which is to analyse room response so acoustic treatment can be optimised. When used just to monitor the frequency spectrum the learning curve is greatly reduced.
Distortion remains a contentious topic. It shouldn't be, but misleading 'specifications' in the early days of transistor amplifiers certainly did no-one any favours. While it's pretty much irrelevant today, the myths have persisted for over 50 years, often reinforced by snake-oil vendors. Our ability to use test instruments that are at least 100 times more sensitive than our hearing should dispel any doubts, but charlatans keep pushing ideas that range from just silly to serious fraud.
One thing that should be fairly obvious is that most modern amplifiers are rather extraordinary. To achieve distortion below 0.1% is almost trivial, which shows just how good most amplifiers really are. One part distortion to 1,000 parts signal (-60dB) isn't much, but less than 0.01% (1 part in 10,000, or -80dB) is no longer difficult to achieve. This is achieved with a handful of resistors, capacitors and transistors, and shows the precision that can be attained - even with relatively simple circuitry. Many digital measurement systems are so good that it's hard to find fault with them technically, but they need a PC which can be a real nuisance. However, the PC removes the need for a great deal of expensive circuitry, so it's a reasonable compromise.
It's interesting that so many articles have been written about the alleged 'ills' of opamps (amongst other modern electronics), along with some rather extraordinary claims. The same extreme scrutiny has not been applied to valve (vacuum tube) equipment, possibly because it doesn't fit the writer's agenda. Much the same applies to many early transistor stages (typically using 2-3 transistors, and a combination of local degeneration (e.g. emitter degeneration) and overall negative feedback. I grew up with both valve circuitry and the early transistor stages, and I know from many years experience that even a TL072 opamp beats the pants off any of them.
When a decent opamp such as the NE5532 or LM4562 is used, there is pretty much nothing to see that isn't buried in noise (even using averaging on a digital scope). The distortion of an LM4562 (for example) is so low that the opamp must be connected in a way that forces it to have very high 'noise gain', which also increases the distortion. The technique is described in the datasheet. This is one of several devices available that are so good that no commercial equipment can resolve the distortion without resorting to 'trickery'.
Distortion isn't the be-all and end-all of course, as other factors influence our perception of sound quality. Noise is present in all amplifying devices, and that can make things better (digital dithering) or worse (audible hiss). The nature of the distortion is important. It's generally accepted that high-order harmonics sound worse than low-order, but the absolute level has to be considered too. 10mV of distortion (with a 1V output) at 20kHz and above will be inaudible (assuming no IMD is generated), but the same level at the second and third harmonic may be very audible - it's only 40dB down, and IMD will result. Many digital systems use 'noise shaping' to force most of the noise components, including digital artifacts including quantising noise (a form of distortion) to be above 20kHz. There may be a great deal of it, but it's raised to be above the audible range.
There's no denying that circuitry has to be auditioned. Not listening to a design you've just built isn't sensible, but making simple comparisons isn't advised either. To be useful, a comparison must be 'blind', so you don't know which unit you're listening to until the test is finished. Levels (and tone controls if fitted) must be matched to within 0.1dB, and the switching system has to be arranged so you don't hear any tell-tale noises (for example, a relay may make a different noise when is opens from that when it closes). Some tests may be so obvious that you'll hear the difference quite clearly, but then you have to be careful that you avoid the common mistake of equating 'different' with 'better'. 'Different' can be better or worse, and our hearing and preconceptions can easily lead to the wrong decision.
We need measurements, because they help to validate a design. No-one would attempt to sell an amplifier with a frequency range from 300Hz to 3.5kHz (never measured, just 'auditioned'), and frequency response will be tested and verified with an oscillator and AC voltmeter (or oscilloscope). I've not heard of anyone eschewing a simple frequency response test, yet the responses can become rather 'excited' when the topic switches to distortion. Both are important, and both are needed to characterise an amp or preamp. Comparatively high distortion is sometimes preferred with some equipment by some people. That's not a problem as such, but the presence of distortion never makes an amplifying circuit 'better'.
There's a great deal of very detailed information available on-line, although some of it will be behind 'pay walls' or simply not able to be located with a normal search. I urge anyone who's interested enough to find out more to do so. Material that's properly researched and peer-reviewed is a far cry from that found in random web pages or forum sites, and I have no intention to try to cover the topic to the same level of detail as you'll find on 'scholarly' websites. However, I do hope that this article gives readers a few ideas, or de-mystifies the topic so the way measurements are performed makes some sense.
One thing that happens on the Net is that some people tend to seek out information that aligns with their preconceptions (called 'confirmation bias'). If something that's blatantly false is repeated often enough, there are those who will assume that it must be true, because they see it 'everywhere'. Repetition of an invalid proposition doesn't magically make it true. There are forum sites where criticising (for example) a cable - speaker or interconnect - will get you banned. That's not how science works, and audio as we know it owes everything to science and physics, and nothing to belief and dogma.
It always amuses me when I see claims that one opamp supposedly has 'better bass' than another. All opamps (yes, every one) work perfectly to DC, so any allegedly perceived difference at (say) 40Hz is obviously imagined. Any change to low-frequency response is created with external parts, and the opamp can't alter that. This is why we measure things, because without objective confirmation, imagination becomes 'reality'. The idea of confirmation bias (aka experimenter expectancy effect) is apparently unknown to many hobbyists, so if they've been told that opamp 'A' has better bass than opamp 'B', a non-blind listening test is likely to confirm the belief. It's safe to say that any two circuits that measure the same (in all respects) will sound the same. When differences are (for example) 1 part in 10,000 (-80dB) it's purely an academic exercise - our hearing simply isn't that good.
Much as I'd like to be able to cite more detailed material, most of it is only available if you pay (and it's usually fairly expensive). Service manuals are a great way to see how various test equipment manufacturers approach the different tasks, including impedance conversion, notch filters, metering amplifiers and any other circuitry needed for the equipment to work. Many of the older manuals are fairly easy to follow, but as equipment gets more advanced, the circuitry is far less useful. A schematic of a digital system isn't much use without the microprocessor system's source code, and that's never provided.
 Main Index Main Index
 Articles Index Articles Index
|