
|
|
| Elliott Sound Products | Intermodulation Distortion |
 Main Index
Articles Index
Main Index
Articles Index
Introduction
1 Demonstration Sound Files
2 DIY Signal Analysis
3 Method 'B'
4 Bench Tests
5 'True' Intermodulation Distortion
Conclusions
Strictly speaking (and in particular from an RF (radio frequency) engineering perspective), the effects that produce sum and difference frequencies are not considered to be a part of intermodulation distortion, but are the result of mixing two frequencies. However, they are included in IEC standards for Difference Frequency Distortion (DFD), which is described in the standards IEC60118 and IEC60268. This test is referenced by Audio Precision, Tektronix and on the Analog Devices website, amongst many, many others. This test specifically refers to the production of the difference frequency as a result of IMD present in an amplifying circuit. From an audio perspective, any frequencies that result from intermodulation are counted as intermodulation distortion, including sum and difference frequencies (should they occur).
For a more in-depth look at intermodulation distortion (IMD) as it is measured in amplifying devices, see Intermodulation Distortion (IMD). The article here concentrates primarily on the production (or otherwise) of sum and difference frequencies, and uses a 'brute force' approach so that the effects are clearly audible. IMD is normally far more subtle, although it's demonstrated in much the same way, but with reduced levels and using the test frequencies that are standardised for IMD testing.
While the primary intent of this article is to allow the reader to demonstrate the phenomenon described for themselves (using ears, and optionally test equipment), it has ramifications for some of the tests that are commonly performed to measure intermodulation distortion. The DFD test referred to above is a prime example, and despite this being entrenched in standards documents, the test itself may fail to consider whether a circuit distorts symmetrically or not.
The most interesting thing about this test method is how it behaves differently depending on whether the waveform and distortion is symmetrical or asymmetrical. Trying to verify this elsewhere is no easy task - I searched many different sources and found few reference to this most interesting behaviour, however a reader did find one other text that mentions the effect, "Audio Measurements" by Norman H Crowhurst (1958, pp98-102) [ 1 ]. The effects described are not 'new', but this is one of very few articles you will find that describe the difference between symmetrical and asymmetrical distortion and how it affects sum and difference frequencies.

This article is not about intermodulation distortion in general. While some of the text does refer to intermodulation, the article is intended to describe a specific case ... sum and difference frequencies. It can be argued that these aren't really intermodulation products but the result of frequency mixing, however the two are pretty much interdependent in a non-linear circuit (at least when asymmetrical). The observations herein are almost completely based on the differences between frequency products that result from symmetrical vs. asymmetrical distortion.
With a symmetrical input waveform, symmetrical distortion does not create the sum and difference frequencies. At least, it doesn't generate a significant level at either the sum or difference frequency, and as noted below, each can be 75dB below the level that's created by an equivalent amount of asymmetrical distortion. For reasons that are very unclear to me, I can find no reference to this phenomenon in any text that I've seen so far other than the one described above. Almost every discussion you see that discusses distortion, intermodulation, and sum and difference frequencies implies (though very rarely stated) that the distortion mechanism and waveform is inconsequential. It's not, and in fact makes a big difference to the behaviour.
So, to get both the sum and difference frequencies, the non-linear part of the circuit must be asymmetrical. If you actually want the sum or difference frequency, you will be bitterly disappointed if you use nice, low distortion input signals and a pair of back-to-back parallel diodes (as shown in Figure 1), because you'll get neither! The sum and difference frequencies are present, but at such a low level that they are inaudible and in real terms, probably immeasurable because they will be buried in noise. If you remove one of the diodes, the sum and difference frequencies reveal themselves immediately.
It is important to understand that just because the sum and difference frequencies are not created by symmetrical distortion, this does not mean that there is no intermodulation. Because of the non-linearity in the circuit, if we examine only the fundamental frequencies (1kHz and 1.1kHz), we see these new intermodulation frequencies generated (all in Hertz) ...
Refer to Figure 4 to see these frequencies for yourself. In the list above, I only included frequencies that are greater than 100µV (-74dB with respect to the two fundamental frequencies). Anything below that level will be swamped by noise in any real test - either when listening or with an oscilloscope/ spectrum analyser. There are additional harmonic and intermodulation products too, of course. Figure 4 shows clusters of distortion at 3, 5, 7 and 9kHz and well above that if the graph were extended. Asymmetrical (supposedly 'nice') distortion also shows similar clusters of frequencies as seen in Figure 3.
I don't expect anyone to believe the findings examined here, because no-one else (apart from the single instance referred to in the intro) appears to have mentioned it. Electronics as we know it has been mainstream for almost 100 years, yet in all that time this phenomenon has gone either un-noticed or deemed to be of no consequence. I consider that it is of great consequence (well, at least some consequence  ) - hence this article. So, assuming that you don't believe me, I suggest that you build the circuit shown in Figure 1, and feed a couple of clean sinewaves into it. You can monitor the output with an oscilloscope fitted with FFT capability, but it is essential that you also connect an amplifier and speaker so that you can hear it for yourself. You won't be able to hear the sum frequency because it gets swallowed up by harmonics, but the difference is definitely audible when the circuit is switched to asymmetrical distortion. Actually, build the circuit and test it for yourself anyway - there's nothing like hands-on testing as a learning tool.
There are many free spectrum analysis tools available on the Net that can be used with your computer and sound card. While the 20kHz upper frequency limit would normally be a problem, it's more than enough for these tests. Such tools are great for just looking at things that you may not have seen before, and are highly recommended for interesting experiments, speaker tests and anything else that requires spectrum analysis in the audio band.
There are two files that you can download - one is a two-tone signal that you can use for testing, and the other is a demonstration of the intermodulation distortion that you can listen to. While this may be convenient to get a basic idea, there is nothing like actually experimenting with the very simple circuit to convince yourself that the phenomenon described is real. I set the difference between the two signals below to 200Hz, as that proved to be clearer through PC and 'real' speakers.
There are two files you can use to test this phenomenon. Both are MP3 format ...
900+1100-intermod.mp320 seconds, 370KB. This is the end result. First 10s, asymmetrical, second 10s, symmetrical
900+1200-clean.mp320 seconds, 613KB. Use this to do your own tests.
intermod-900+1200-clean.mp3 download (You may need to right-click and select 'Save File As...')
In the first 10 seconds of the 'intermod' file, the 200Hz difference tone is clearly audible, and it all but disappears when the clipping becomes symmetrical. I didn't match the diodes, so some small asymmetry still remains, but I think it demonstrates the point pretty well. The sounds here have been re-recorded (again), changing the 1,200Hz tone to 1,100Hz, with a 200Hz difference frequency. Having experimented with a few speakers, this version is definitely clearer than the 1,200Hz + 900Hz version. The recordings are direct from the clipping circuits.
The second (clean) tone is the original, using 1,200Hz and 900Hz. The 300Hz difference tone is audible when distortion is added, but I think the new recording shows the results more clearly, using 1,100Hz and 900Hz. The original distortion recording is still available ... 900+1200intermod.mp3. It's only 10s duration, with 5s for each form of distortion.
With two signals, one at 1kHz and the other at 1.1kHz, apply around 1V RMS from each of the signal generators - keep the two signal generators at roughly the same level. Advance the pot until you have enough level to obtain 'just visible' (or just audible) distortion. With the circuit shown the pot needs to be set for about half level. With the second diode connected, you don't hear any 100Hz tone, but as soon as you disconnect it, the 100Hz tone is clearly audible, and it will show up in the signal spectrum. You might want to use 900Hz and 1.2kHz (as used in the above sound files), as the 300Hz tone is more audible than 100Hz with small speakers.
If you have a simulator program on your PC, you can also run a simulation. You'll see exactly the same thing if you set up the circuit as shown in Figure 1.
This test actually came about while I was testing something completely different. Many people wax lyrical about the 'nice' distortion created by certain amplifiers, not realising that asymmetrical distortion creates not only the allegedly nice even harmonics, but also creates plenty of (allegedly nasty) odd harmonics as well. The total intermodulation products are actually greater with only one diode than with both (D1 and D2, Figure 1). I freely admit that no amplifiers normally show the type of distortion I used, but I was testing a theory, not looking for absolute specifics.
The green trace shows the asymmetrical distortion, while the red trace is symmetrical. The input voltage is the same for both, but the peak amplitude is slightly lower with symmetrical distortion because both positive and negative peaks are (soft) clipped equally. The soft clipping behaviour is clearly visible on the negative peaks of the red trace.
Soft clipping notwithstanding, this is a rather brutal demonstration, because it challenges so much of what has become 'common wisdom'. It is especially challenging when you run the tests for yourself. Even if you don't have an oscilloscope (let alone a digital model with FFT), the effects are immediately audible. If you don't have a signal generator, you can use your computer sound card, and generate the tones in software (using Audacity for example), or you can cheat and just download the file I already created (with Audacity ... intermod-1k0+1k2.mp3 20 seconds, 315KB, right-click and select 'download;). You will need fairly heavy distortion to make the effect audible, otherwise the difference frequency is masked by all the other frequencies.
As you can see, there is a never ending stream of harmonic and non-harmonic frequency content. I stopped the trace at 10kHz, but it extends to infinity. After 8kHz the levels are less than 1mV (~70dB below the fundamentals). This also applies to the next trace, and there's no point continuing after the harmonic content is buried in noise as will be the case with a 'real' (as opposed to simulated) test.
To make it easier to see which is which, I made the FFT green to match the green trace in Figure 2 and the FFT below is red to match the red trace. I also indicated where the sum and difference frequencies either are or should be - in the symmetrical test it's quite obvious that they are missing, although there is a vestige of the difference signal at 100Hz (but it's only at around 5µV and can be ignored).
So, having looked at the simulated harmonic structure shown in Figures 3 and 4 we can make some observations. As you can see, both charts have exactly the same voltage and frequency ranges, so it's easy to compare the levels of all harmonics and intermodulation products. You can see the difference frequency at 100Hz, along with additional harmonics at 200Hz, 300Hz, etc. These diminish up to 500Hz, after which they start getting larger again. The sum frequency is 2.1kHz - again, clearly visible in the asymmetrical case (Figure 3) but missing entirely with symmetrical distortion.
The difference frequencies are also visible with symmetrical distortion, but at significantly lower levels. At 100Hz, the difference is 75dB - the symmetrical distortion circuit produces a difference frequency (100Hz) that is almost 75dB lower than the 100Hz component from the asymmetrical circuit. Now, look closely at Figure 4 again.
Right where the sum frequency should be (2.1kHz), there is ... nothing. Zip. Bugger all. So, symmetrical distortion not only eliminates the difference frequency, but there is no sum frequency either. Everyone keeps saying that intermodulation distortion creates sum and difference frequencies, but it only does so when either the non-linear circuit or the input waveform is asymmetrical!
You can see easily that the FFT for symmetrical distortion is much less cluttered than that with asymmetrical distortion, yet it still manages to sound slightly harsher. This is despite the fact that there are more harmonic and non-harmonic artifacts, but comparatively little by way of sum and difference frequencies. However, there are very obvious sidebands around the input frequencies, and if you look closely at the third order IMD (900Hz and 1,200Hz) and fifth order IMD (800Hz and 1,300Hz) you can see that the true intermodulation products are higher with symmetrical distortion.
The apparent reduction of 'clutter' is counter-intuitive and unexpected, especially since the harmonic distortion levels are quite similar (12.85% symmetrical vs 12.67% asymmetrical). It is likely that all non-linear circuits will show similar performance, at all levels. I also simulated a simple one-transistor amplifier and got very similar results (asymmetrical of course), with less than 1% THD, the sum and difference frequencies are very prominent as expected. It is probable that many people have seen the effects described when looking at FFT measurements of audio frequency (and radio frequency) signals, but have not realised the implications. In reality, while the 'clutter' is less apparent with symmetrical distortion, the levels of IMD are greater.
When the level is reduced, so too is the distortion, but the ratios will remain much the same between symmetrical and asymmetrical distortion mechanisms. Bear in mind that music is rarely symmetrical, and it doesn't matter if the signal or distortion mechanism is asymmetrical - either gives the same result. It's only when THD is reduced to less than 0.1% that intermodulation products are reduced to an acceptable level. It's important to note that any amplifying device that introduces harmonic distortion will also create intermodulation products - the two are inextricably interrelated. As THD is reduced, so too is IMD. No amplifier of any kind has ever been built that has significant (ie. measurable) THD but no IMD or vice versa.
After a minor epiphany, I thought I'd test another possibility, namely that the sum and difference frequencies are created with symmetrical distortion, but with equal amplitude and opposite phase. This would mean that all of the signals that 'disappear' when the distortion is symmetrical do so because they are equal and opposite, and therefore cancel each other. The simulator was the obvious choice, and the circuit was tested.
Sure enough, each individual signal had sum and difference frequencies, but when summed they vanished. This is proof enough for a valid theory that supports exactly what we see and hear. The test circuit is shown below, and it can easily be entered into any simulator so you can verify it for yourself. You can also build it, but be warned that the setting of VR1 and VR2 will be very sensitive. Even a small difference will result in visible (on an FFT) and audible sum and difference frequencies. You will almost certainly have to use separate 10 turn trimpots to be able to set them with enough precision to get a good result.

With something as bizarre as this, normal methods of investigation don't work. The time domain (normal oscilloscope display) doesn't give us enough information, and the frequency domain leaves out the all important phase information. The chosen technique involves separating the two signals. One has distortion on the positive peaks and the other has the same amount of distortion on the negative peaks. One might apply theoretical maths to the problem, but my background is practical, not theoretical (at least not at this level), and I don't have the maths skills to even attempt a mathematical solution.
Each signal by itself has sum and difference frequencies (readily detected at 'A' and 'B' in Figure 5), but when summed they vanish. The only way that can happen is if these frequency components have exactly equal amplitude and are 180° out-of-phase. Since they do indeed vanish, we can conclude that the signals must be as we imagined.
Now we know the exact mechanism that causes the sum and difference frequencies to disappear with a symmetrical distortion circuit. If there is slight asymmetry (unequal diode forward voltage or pot settings for example), the sum and difference frequencies will still be 180° out of phase, but will not have identical amplitudes. Therefore, cancellation is not complete, and the sum and difference frequencies will pop right up again, but at a lower than normal level.
I also tested this in the simulation, and even a tiny amount of difference between the two distorted signals will cause the sum and difference frequencies to rise up out of nowhere. Since correlation between simulation and physical testing was extremely good (see the next section), it's quite safe to expect that the simulated results of the expanded test will matched by reality. I didn't test this because I'm happy with the simulated results, which would simply be duplicated but with less precision.
There are a few other traces for you to look at. The following were captured using my digital oscilloscope, and show the waveform and FFT for each. I used 1.0kHz and 1.2kHz for these because the 200Hz difference frequency is easier to hear with small speakers. You can also listen to the waveforms - intermod.mp3. The first 3.5 seconds is with both diodes, and the remaining 3.5 seconds uses only one diode. Listen for the 200Hz tone that becomes (more) audible at the halfway point in the file.
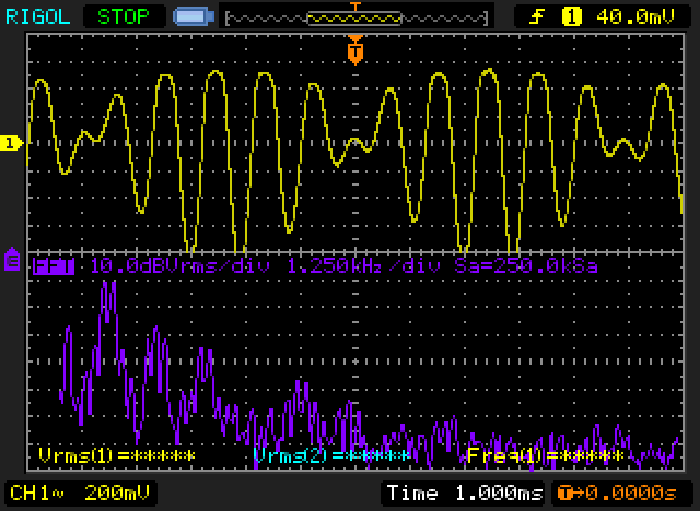
The first two traces were captured directly across the diodes, and the second two were captured from the wiper of the pot. Even though there is a resistor between the output and the diodes, the distortion is quite visible and was also audible. (I actually used 7.5k resistors because they were the first to hand). Note that the signal waveform is different in some of the following traces. This does not mean that anything significant is different, only that the phase relationship between the two sinewaves has changed ever so slightly. This is not audible.
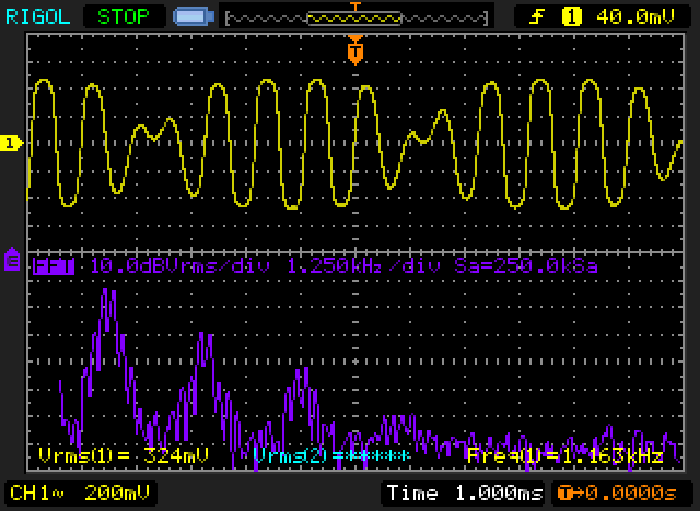
You can see the first set of harmonics at 3kHz and 3.6kHz and the next set at 5 and 6 kHz. Seventh harmonics are also just visible before everything disappears below the noise level. In the next trace, you can now see both odd and even harmonics, as well as the difference frequency (200Hz) at the left of the screen. Note that the 4th harmonic is not present. If you refer back to Figure 3 you will see that the 4th harmonic group is less than for the 5th harmonic group too - the simulation and real life are remarkably close.
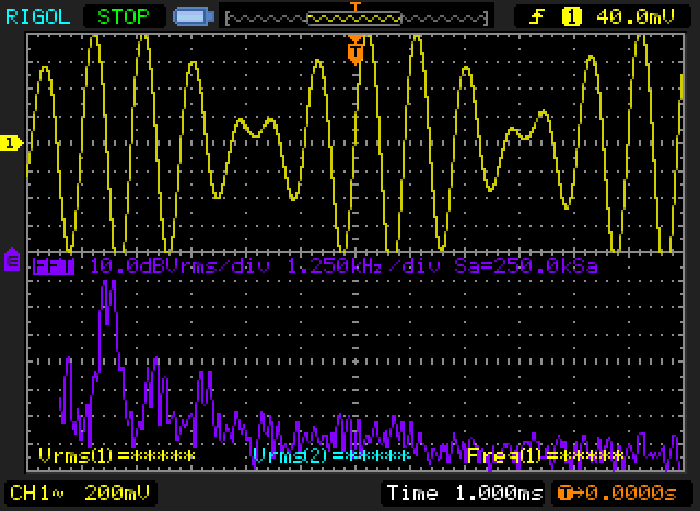
The next two traces were captured at the pot wiper, with a 7.5k resistor between the pot and the diode(s). The oscilloscope and monitor amp were connected to the pot wiper, and the diode(s) are partially isolated by the resistor. Distortion is not readily visible on the waveform, but can still be seen in the FFT and is clearly audible. The first set of harmonics (around 2kHz) is 30dB below the fundamentals rather than ~18dB in the first two examples in this section.
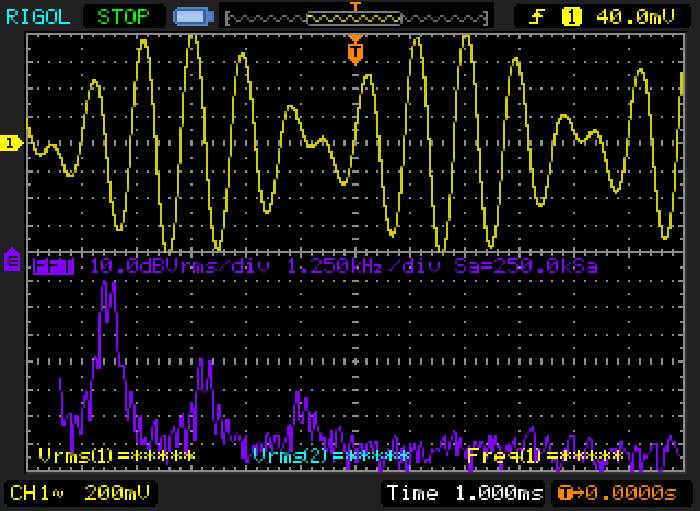
The amplitude of the two fundamentals is greater because the measurement was taken from the pot wiper. Distortion is not visible on the waveform, but is clearly evident in the FFT trace. There are two things that tell you instantly which is which - the first is the presence or otherwise of the difference frequency (200Hz), and the other is the nature of the harmonics. Symmetrical distortion has no even harmonics (or at least much lower levels because perfect symmetry is hard to achieve in practice).
You will most likely find that the asymmetrical distortion actually sounds less harsh than the symmetrical version, despite the fact that it has more harmonics overall. Like so many other things, this is probably not what you would normally expect. I suspect that the reason is purely psycho-acoustical in nature - anything with bass (or at least a low frequency) will tend to sound 'nicer' than an otherwise similar sound without a low frequency.
Having established that looking for sum and difference frequencies won't work with any amplifier that is truly symmetrical, it's worth looking at the real nature of intermodulation distortion. There are many standards (such as IEC60118 and IEC60268) that do refer directly to the difference frequency, and it's a test that's often used. As described above, if the device under test (DUT) is symmetrical, it won't show anything, even though the DUT may have considerable intermodulation distortion. The test is known as a 'difference frequency distortion' (DFD) test.
From the Audio Precision website that explains the test ... "The DFD stimulus is two equal-level high-frequency tones f1 and f2, centred around a frequency called the mean frequency, (f1+f2)/2. The tones are separated by a frequency offset called the difference frequency. The two tones intermodulate in a distorting DUT to produce sum and difference frequencies."
Intermodulation causes a degree of amplitude modulation of one or both frequencies. If the SMPTE RP120-1983 standard is applied, the DUT is subjected to a 60Hz tone and a 7kHz tone at the same time, with a ratio of 4:1 respectively. The results are obtained by examining the 7kHz frequency, which should be a pure tone. If intermodulation is present, sidebands will appear. These indicate that amplitude modulation of the 7kHz tone is present, with the sidebands spaced at 60Hz intervals. An FFT of the result might look like the following graph.
The sidebands are clearly visible, and show that the 7kHz tone is amplitude modulated. This is intermodulation distortion, and is shown at a representative level for an amplifier with a THD (total harmonic distortion) of around 0.0075%. (THD+N measured 0.013%). An amplifier with less distortion may show only the 7kHz tone, with the sidebands (they will be present) buried in the noise. The graph shown is somewhat optimistic, with a noise level of about -132dBV (250nV output noise, which was deliberately injected so that the FFT was closer to reality). Note that the sidebands are spaced at 60Hz intervals.
It's important to understand that the majority of this page describes only sum and difference frequencies, and the conditions under which they are (or are not) created. The amount of distortion is deliberately much greater than you'd normally see to highlight this particular issue. IMD is a complex topic, and the reader is advised to look at articles that describe it is detail. That doesn't diminish the points made here though - attempting to measure IMD by looking for sum and difference frequencies will only ever work when the distortion mechanism is asymmetrical.
It's interesting (to me anyway) that it seems that no-one else has ever thought to verify that sum and difference frequencies are not created when symmetrical distortion is applied to a complex (but symmetrical) waveform. It's important to understand that if the input waveform(s) is/are asymmetrical, then even a symmetrical clipping circuit as demonstrated here will still cause asymmetrical distortion, so in some respects it's a moot point. I also tested this by clipping one of the input signals before it reached the pot, and as expected the difference between one and two clipping diodes disappeared.
The additional info described in Method 'B' has provided the solution to how this happens. It's no longer a mysterious phenomenon, but is now explained in a way that makes perfect sense. Although I simulated the test circuit but didn't build one, as seen above all simulations were very closely matched by bench testing, so I am confident in the results. We now have a reasonable explanation as to exactly why completely symmetrical distortion doesn't produce sum and difference frequencies. It is even (theoretically) possible to determine the degree of asymmetry based on the proportions of the sum and difference frequencies compared to the fundamentals, but this would be rather pointless. We can see that far easier by just looking at the harmonic structure - even harmonics indicate asymmetrical distortion.
This has been a very interesting bit of research that has revealed something I've never seen mentioned (until advised of reference 1). Like much research, the end result isn't terribly useful to anyone because 'real world' signals will rarely be perfectly symmetrical when looked at over any sensible period of time. Just like it's entirely possible for all the violins in an orchestra to be in phase for brief periods (which will seriously mess up a surround decoder [ 2 ]), it's also a given that there will be brief periods where an audio waveform (for example) is perfectly symmetrical.
Just in case anyone is wondering just how I came across this intriguing phenomenon, it was while I was testing the hypothesis that even-order distortion sounds 'nicer' than odd-order distortion. In the process, I was listening to two tones and heard the difference frequency disappear when I switched from asymmetrical to symmetrical clipping. "That's interesting" I thought, and the rest is history.
There is another way to look at this issue as well. The same frequencies as described above are assumed - 1kHz and 1.1kHz. Symmetrical distortion means that there are only odd-order harmonics - even order harmonics are suppressed/ cancelled. Since the sum frequency (2.1kHz) is midway between the second harmonic frequencies of the two original signals (either 2kHz or 2.2kHz) then by definition it should not exist. It can be argued that 100Hz (the difference frequency) is also an 'even' frequency or sub-harmonic, and therefore also should not exist. I'm not completely happy with this explanation, but it may help readers to understand the processes involved.
Despite the marginally 'softer' sound with one diode, the whole exercise belies the claims made by those who say that second harmonic distortion is pleasant and adds to the music. It doesn't do anything of the sort. Well, it does add to the music, but the additions are unwanted. It is also important to understand that second harmonic distortion by itself never exists in any real-world amplifying device - it is invariably accompanied by higher orders of even harmonics (4th, 6th, 8th, etc.) and odd harmonics. The odd harmonics simply come with the territory, and are free. Using push-pull circuitry (symmetrical) can all but completely cancel even harmonics, leaving only the odd harmonics. These are somewhat less intrusive - primarily because the levels of all harmonics are reduced significantly. Adding feedback (proper negative feedback, not simple emitter/cathode degeneration) will reduce distortion further.
Provided the amplifier has reasonable open-loop bandwidth and is fairly linear to start with, negative feedback will reduce all harmonics and IMD. The latter is by far the most crucial, and only when intermodulation distortion is minimised can you really claim to have a transparent amplifying device.
|
| On the basis of this information, it is likely that many intermodulation distortion tests are meaningless. Using a 19kHz and 20kHz tone and expecting to see 1kHz is fine (a 'difference frequency distortion' test as described above), but it will only work if the amplifier being tested has asymmetrical distortion. With most real-world push-pull amplifiers, or any other topology that has very low levels of second harmonic distortion, this test will be decidedly optimistic, and may fail to show the real IMD caused by the amplifier. |
I'd love to have been able to include some references, but there is only one ... plus the next three snippets (2-4)
There are countless references to using the DFD test to measure intermodulation, but very few (only one that I found) points out that there is a difference between symmetrical and asymmetrical distortion. Some of those I located are shown below (I no longer show most complete links because they have an annoying habit being moved, so often don't work).
Main Index
Articles Index