

|
| Elliott Sound Products | Intermodulation Distortion (IMD) |
 Main Index Main Index
 Articles Index Articles Index
|
I suggest that you also read Intermodulation (?) - Something 'New' To Ponder, which was the forerunner to this article. It covers the specific case of sum and difference frequencies in detail, showing how they may not appear at all, despite considerable harmonic and intermodulation distortion.
IMD (intermodulation Distortion) is one of the main culprits that can make amplifiers sound 'bad'. It's heavily reliant on harmonic distortion (THD - total harmonic distortion plus noise), but not in any easily calculated way. Any amplifier that has harmonic distortion, has intermodulation distortion as well, and the converse is also true. Harmonic distortion (as its name suggests) generates harmonics of the original signal. A 1kHz tone will have 2kHz, 3kHz, 4kHz, 5kHz (etc.) harmonics, but in some cases the even harmonics are suppressed (2nd, 4th, etc.). Push-pull amplifiers (regardless of topology) fall into this category, and have predominantly odd harmonics only. This is never true in real life - all amplifiers, regardless of what they use as an amplifying device, have both odd and even harmonics, but the even harmonics can be below the noise floor. Just as it's impossible to design an amplifier that presents only the second harmonic, all amplifiers will have some of every harmonic present. Hopefully, most will be far enough below the noise floor that the distortion is not intrusive.
Unlike harmonic distortion, intermodulation generates frequencies that are not harmonically related. This makes them far more objectionable, because the frequencies generated are unrelated to the input frequencies. It's important to understand that the process of distortion (of all forms) is simply due to non-linearity. The amplifying device does not 'generate' the new frequencies directly, but they are an inevitable by-product of distortion. When the shape of a waveform is changed, the harmonics (and/ or other frequencies) are created simply due to the physics of waveforms. A pure sinewave has (by definition) no distortion, and consists of a single frequency - the fundamental. Distortion is due to non-linearity, and that modifies the shape of the waveform.
An amplifier does not have to deal with multiple frequencies simultaneously. There is one value of voltage and current present at any instant in time, and the 'signal' does not pass through an amplifier and its feedback network multiple times (yes, this claim has been made many times elsewhere). The instantaneous value of the input is amplified, and that amplified version is attenuated by the feedback network and compared to the value present at the input. Should the two differ, the error amplifier (the first stage of the amplifier) tries to correct the difference in real time. Should the input signal change faster than the amplifier can react, the amplifier is no longer in its linear range, and the results are not useful.
There also seems to be a 'difference of opinion' between RF (radio frequency) and audio engineers as to what actually constitutes IMD. Strictly speaking (for an RF engineer), IMD does not include the sum and difference frequencies, whether they are measurable or not. Audio engineers do consider sum and difference frequencies to be part of intermodulation distortion, since they are produced by the same mechanism that creates other IMD products.
In a circuit with symmetrical distortion, these products are not evident at measurable levels, and they only appear if the distortion is asymmetrical. In RF work, the sum and difference frequencies are the expected result of mixing two frequencies together (in a deliberately non-linear circuit). Over the years, it appears that these sum and difference frequencies have been classified as part of IMD for audio, but not for RF. For audio applications the sum and difference frequencies are unwanted, and thus should be (and are) included as IMD products.
Another term you'll come across is PIM (passive intermodulation), most often associated with junctions of dissimilar metals and/or oxide layers at a connection. This is rarely a problem with home audio, because the conditions that cause serious oxidation are (usually) not present. PIM is most likely to occur with high RF power levels, combined with the effects of corrosion caused by atmospheric pollutants, oxygen and moisture. This is a separate topic, and is not part of this article.
The effects of harmonic distortion are generally benign, provided the total measured distortion is less than 0.01%. In some cases it can be greater without becoming audible, but anything over 0.5% is decidedly 'lo-fi' (as opposed to 'hi-fi'). The actual value where it becomes objectionable depends on many factors, not the least of which is the type of material. For a single guitar played through an amplifier deliberately driven into clipping (aka 'overdrive'), the distortion levels are extreme, but this forms part of 'the sound'. Play music through the same system (and with the same amount of clipping) and the end result is intolerable.
Any amplifier that has harmonic distortion also has intermodulation distortion, and of course the converse is also true - the two are inseparable. While harmonic distortion (THD) is less obtrusive than IMD, high levels of THD also mean there will be high levels of IMD. Many in audio consider THD tests to be 'pointless' because they don't describe 'the sound' or because sinewaves are 'too simple' to perform a meaningful test. These attitudes are based on the false premise that an amplifier somehow is subjected to multiple simultaneous frequencies, which is simply untrue.
Intermodulation is vastly more complex than THD, and the result is that (usually higher) frequencies are amplitude modulated by lower frequencies. This is immediately apparent when an amplifier clips, but there will always be some degree of IMD even at low levels, well below maximum power. IMD acts not only on the original frequencies, but also on their harmonics, as well as the new (non-harmonic) frequencies created by IMD itself. It doesn't take a great deal of IMD to render the signal objectionable to listen to, and it's naturally worse with complex passages.
The optimum way to measure IMD is to use the SMPTE (Society of Motion Picture & Television Engineers) standard RP120-1994, which uses a 60Hz tone and a non-harmonically related (usually 7kHz) tone, with an amplitude ratio of 4:1 (low:high). This test looks for sidebands around the 7kHz tone, the presence of which indicates amplitude modulation, and therefore intermodulation distortion. The 7kHz signal is shown below, showing the presence of IMD.
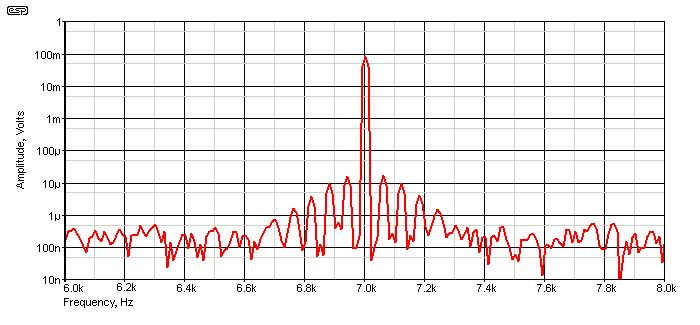
Figure 1 - 7kHz Tone Showing IMD Sidebands
The sidebands are clearly visible, and show that the 7kHz tone is indeed amplitude modulated. This is intermodulation distortion, and is shown at a representative level for an amplifier with a THD+N (total harmonic distortion plus noise) of around 0.013%. An amplifier with less distortion may show only the 7kHz tone, with the sidebands (they will be present) buried in the noise. The graph shown is somewhat optimistic, with a noise level of about -132dBV (250nV output noise, which was deliberately injected so that the FFT was closer to reality). The sidebands are spaced at 60Hz intervals if distortion is asymmetrical or at 120Hz with symmetrical distortion (the 60Hz tone is the 'modulating' frequency). In RF parlance, the 7kHz tone would be the 'carrier' frequency.
The SMPTE test will show the sidebands regardless of whether the distortion is symmetrical or asymmetrical. However, if the distortion is symmetrical, the even-order sidebands won't exist, and they will be spaced at 120Hz intervals, not 60Hz. Although the number of visible sidebands is reduced with symmetrical distortion, the amplitude of those remaining is slightly higher for the same measured THD. If the same circuit is subjected to the CCIF (now IUT-R) IMD test, a 1kH (difference frequency) signal will only be seen if the circuit is asymmetrical. Information on who may or may not use the difference frequency as a 'metric' for IMD is hard to come by. In some cases it's called a DFD (difference frequency distortion) test, which implies that the measured level of the difference frequency is used, but a few sentences along that changes again.
Given that the ITU-R IMD test based on IEC60118 and IEC60268 (apparently) rely on detection of the difference frequency, as discussed in Intermodulation (?) - Something 'New' To Ponder, amplifiers with symmetrical distortion will fail to provide a reliable result (they may fail to give a result at all - even though the amplifier may have considerable IMD). It's difficult to know how this standard came about, since we know that symmetrical distortion will not produce the sum and difference frequencies. As noted in the referenced ESP article though, this is something that many people seem not to know (which puzzles me, but so do many other things (at least vaguely) related to audio). 
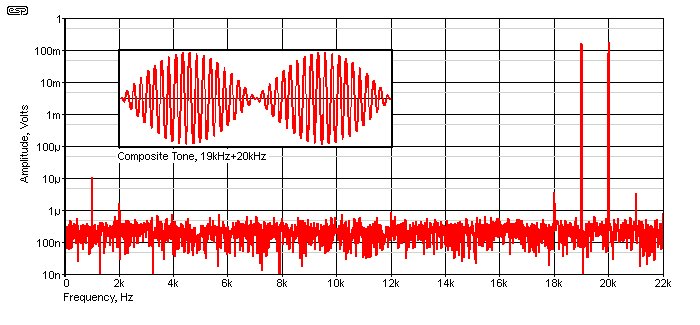
Figure 2 - 19kHz + 20kHz Tones Showing IMD Sidebands & Difference Tone (Inset: Composite Tone)
The inset shows the waveform of the composite (19kHz + 20kHz) tone. The amplitude variation you see is not amplitude modulation, but shows the beat frequency (which is at 1kHz). It's rather important that you don't confuse beat frequencies with intermodulation, as they are completely separate phenomena. While beat frequencies can easily be audible, that will only occur if both tones are audible individually. The 'beat' is simply the result of alternating constructive and destructive pressure waves arriving at your ear, or (and as shown) constructive and destructive reinforcement of the electrical signal. The inset is also a demonstration that there are never two separate signals - when added together you get a composite waveform, and only one value of voltage is present at any point in time.
As a sidenote, beat frequencies are often used by guitarists to tune their instruments (e.g. 'harmonic tuning'), and by piano tuners who favour the 'old fashioned' way to tune, by counting the number of beats for specific harmonics when two notes are sounded together. Predictably, this is outside the scope of this article, but most musicians will be well aware of beat frequencies and their importance.
With an amplifier having asymmetrical distortion, the graph above shows the difference tone, as well as sidebands spaced 1kHz apart at 18kHz and 21kHz. The two sidebands are a good indicator of IMD, but the difference tone at 1kHz is not. This is shown clearly in the following graph. The sidebands are created by any non-linearity in the system (including the measurement equipment!). If the sidebands are present, the signal(s) have been subjected to a degree of amplitude modulation, which is the direct result of non-linearity. Whenever a circuit is non-linear, the amount of amplification will change depending on the amplitude of the input signal. For example, a particularly poor amplifier may show a gain of 10 (20dB) at 1V input, and a gain of 11 (20.8dB) at 100mV. It doesn't matter if the voltage is AC or DC.
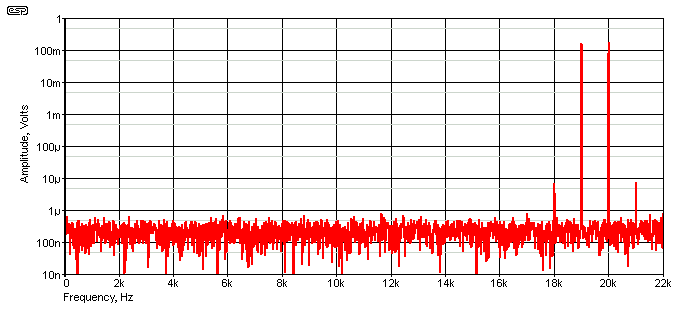
Figure 3 - 19kHz + 20kHz Tones Showing IMD Sidebands Only
When the distortion is symmetrical (as will be the case with almost all push-pull amplifiers), the difference tone disappears. The IMD can still be judged by the sidebands at 18kHz and 21kHz (third-order IMD products), and that is supposed to be what is measured when the ITU-R test is applied. Therefore, it's safe to say that this method works, provided sum and difference frequencies are not considered. Unfortunately, obtaining any standards document anywhere in the world is expensive, so I don't have access to all the details of the test procedure.
Amplifier non-linearity is a fact of life, but most competent designs manage THD and IMD levels that are below audibility. Earlier I stated that an amplifier has no 'understanding' of the waveform at its input, only the instantaneous voltage at any point in time. Based on this, you may wonder how (and why) more complex musical passages can create more complex intermodulation products. The answer is as simple as it is complex, and doesn't change the basics one iota.
The circuit I used to produce the three graphs shown above is very simple indeed. It consists of nothing more than two 'ideal' (i.e. distortion-free) sinewave voltage sources, and an attenuator ultimately leading to a pair of diodes. The distortion is deliberately very low - this article is about IMD specifically, and high levels of distortion are neither necessary nor useful to produce the results. However, to be able to demonstrate exactly what happens with waveforms you can see requires a more savage test, and the results are shown here.
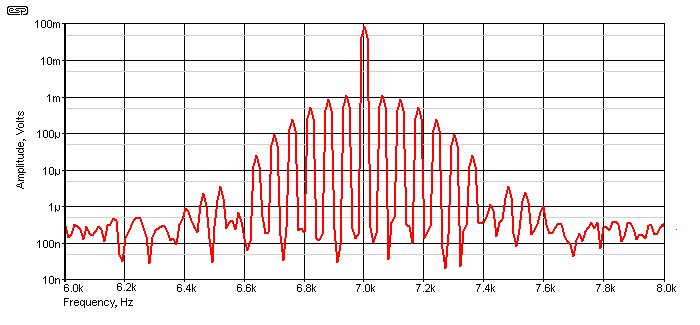
Figure 4 - 7kHz Tone Showing IMD Sidebands (Exaggerated For Clarity)
The sidebands are much more prominent now. Whereas the tests described earlier would show no sign of visible amplitude modulation, in the graph below it can be seen. There's still not very much, with the peak variation being from 82mV to 72mV (about 12%), and it only occurs briefly during the 60Hz cycle. A single diode was used, but you can see that the amplitude of the positive and negative peaks are affected, although not equally. The waveform is shown below, with the 60Hz component removed by a notch filter.
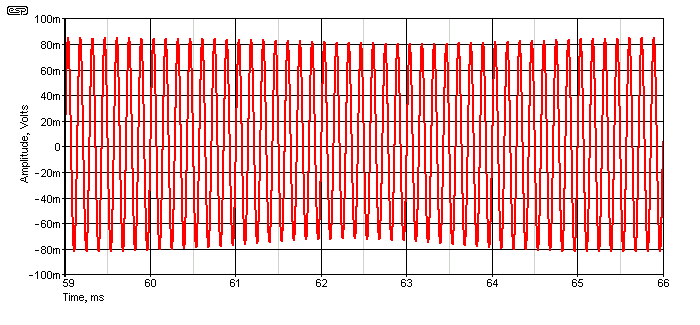
Figure 5 - 7kHz Tone Showing Amplitude Modulation
Only a part of the residual 7kHz tone is shown, purely because trying to show it all simply results in a solid block of red with the waveform itself not visible. The results shown are simulated, but if I were to set up a workbench example the same way, I'd get exactly the same result. The circuit used for the simulation is shown next, and it's apparent that the effect of the diode is quite small, given the circuit impedances seen in the schematic. The buffer is included so the notch filter doesn't affect the two voltages applied to the distortion circuit.

Figure 6 - 60Hz + 7kHz Test Circuit
The test circuit I used for the simulations is shown above. Although the frequencies and amplitudes shown are intended for the SMPTE test method, they can be replaced by two equal amplitude generators spaced 1kHz apart (e.g. 19kHz and 20kHz). The switch allows the use of a single diode (asymmetrical) or two diodes (symmetrical) so the effects of both can be examined. The 1k pot allows the amount of distortion to be controlled, at maximum resistance the distortion is low, and it increases as the resistance is reduced. The 60Hz notch filter is not required for ITU-R tests. In case you are wondering why there are no component values for the notch filter, that's because they are very precise and decidedly non-standard values to get a perfect notch at 60Hz. R and C values are determined using the standard RC filter formula ...
f = 1 / ( 2π × R × C )
Without the notch filter in circuit, it becomes difficult to measure the IMD sidebands of the 7kHz tone because the amplitude of the 60Hz component forces a higher level setting for the FFT analyser to accommodate the low frequency without creating additional distortion. If you have a distortion meter, the 60Hz tone can be removed with the internal notch filter, and the distortion residual output will show the level and distortion present on the 7kHz tone. The distortion will only be visible on a scope if it's greater than (around) 5%, but you might be able to see amplitude modulation if the IMD is great enough.
The above test circuit can be used if you wish to take measurements. The notch filter has to be tuned very carefully, and if the DUT (device under test) is am amplifier or preamp, no buffer is necessary. With this arrangement and a competent scope (or a PC sound card with an appropriate input attenuator), you can see the IMD products fairly easily by running an FFT to examine the signal in the frequency domain.
The notch filter isn't essential, but it makes it far easier to see the IMD products. The only thing missing will be the 60Hz signals, but THD products will still be present at 180Hz, 300Hz, 420Hz, 540Hz (etc.) assuming symmetrical distortion. With asymmetrical distortion, even harmonics of 60Hz will also be visible. Be aware that if a simple notch filter as shown (without feedback) is used, the harmonics of the 60Hz tone will be attenuated. The second harmonic (120Hz) is attenuated by 9dB, the third by 5.1dB, fourth by 3.3dB, etc. These are harmonic distortion artifacts and can be ignored for IMD measurements.
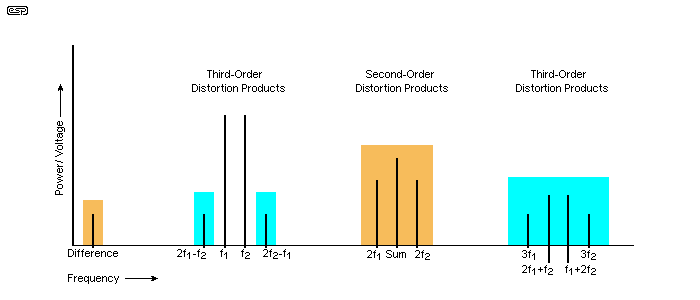
Figure 7 - Intermodulation Distribution (ITU-R Method)
The areas in a brown background do not appear with symmetrical distortion, while those on a green background are always there when IMD is present. This makes complete sense once you know that sum and difference frequencies aren't generated with symmetrical distortion, nor will there be any second harmonic distortion (which also requires an asymmetrical distortion mechanism). Therefore, with symmetrical distortion, any IMD products are limited to odd-order effects only. With a symmetrical distortion process (two diodes in Figure 6), the third-order products are greater than for the same basic arrangement, which also makes sense because both peaks are affected rather than one. This results in more amplitude modulation.
I expect that for many readers, the production of AM (amplitude modulation) may be somewhat mysterious, and it's necessary to look at a somewhat more radical example so that it can be easily understood. The example I'll use is rather drastic, but it is the clearest possible example. When two signals are added together (and I'll use a 60Hz + 1kHz (not the normal 7kHz tone), the peak amplitude is the sum of that of the two individual frequencies. If you have peak levels of 1V at 60Hz and 250mV at 7kHz, the total peak level is ±1.25 volts. In reality, these can be any two voltages, or frequencies that are far enough apart that the composite waveform shows each as individual signals, with the high frequency 'riding' on the lower frequency. This is shown below. I used 60Hz and 1kHz so the two signals would be visible. The level of the final signal is ±412mV peak, due to the three resistors. VR1 is reduced to its minimum value for this test, to get maximum 'visibility' of AM in action.
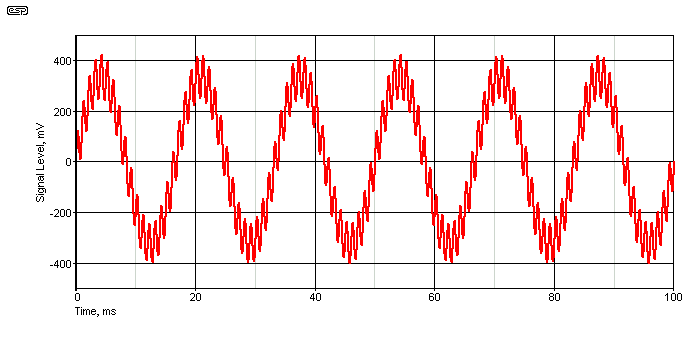
Figure 8 - Composite Waveform (60Hz, 1kHz, SMPTE)
If we now imagine that the amplifier in question cannot pass the full ±412mV peak due to the diodes, some of the 1kHz waveform will be attenuated at the peak of the 60Hz waveform. Apart from the fact that the 1kHz tone is now distorted, its level is also reduced to less than it should be. So an 83mV peak signal (after attenuation) is reduced to (a distorted) 72mV peak. It has been amplitude modulated. The resulting 1kHz tone is shown next, replete with distortion (which is very hard to see). The 60Hz tone has been removed with the notch filter.
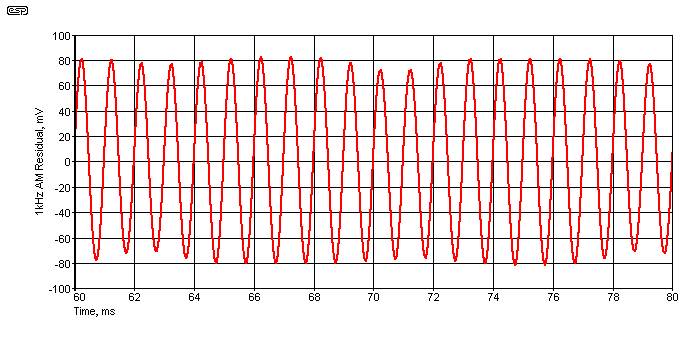
Figure 9 - Amplitude Modulation
The AM on the 1kHz tone is visible above, and the tone is also distorted. The simulator says that THD is 0.78%, which almost seems as if it should be audible, but not necessarily objectionable. The problem isn't simple harmonic distortion though, it's the IMD products generated. Two plots are shown below, the first with asymmetrical distortion (which produces supposedly 'nice' even harmonics), and the best you can say for it is that it's a mess.
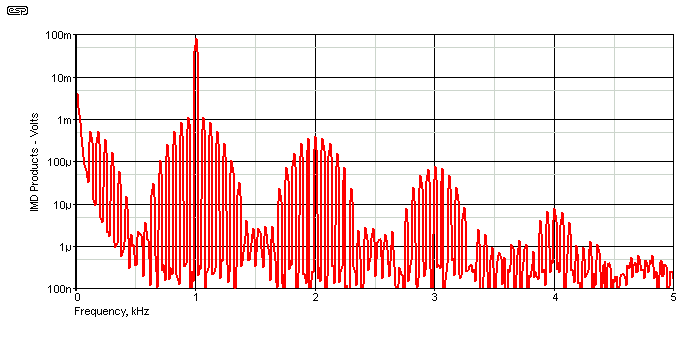
Figure 10 - IMD, 1kHz Tone, Asymmetrical Distortion
In contrast, the following plot is for symmetrical distortion (two diodes). Although the peak amplitude of some of the sidebands is slightly greater due to a little more AM, the overall picture is far less 'cluttered', with fewer IMD products overall. However, even though there are fewer IMD frequencies produced, that doesn't mean that it will sound any better. IMD always sounds bad, regardless of the mechanism that produces it.
Note that although 1kHz was used in this test, there are IMD products at 2, 3, 4 and 5kHz. When the high frequency tone is 7kHz, that results in IMD at and around 14, 21, 28 and 35kHz, and the IMD 'artifacts' extend to much higher frequencies as well. Whether these can be measured depends on the test equipment available, and frequencies above 21kHz (the third harmonic of 7kHz) can be ignored because they are inaudible. The distortion is still present though, and may cause further intermodulation, potentially including difference frequencies of IMD products with wide band material (as opposed to a 'simple' two-tone test) signal. IMD is complex, and the more frequencies present at the input, the more IMD is developed.
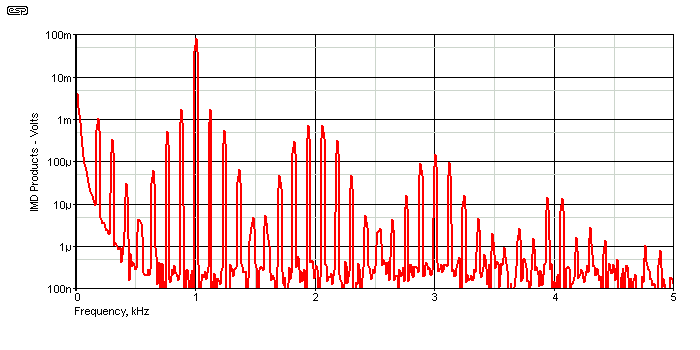
Figure 11 - IMD, 1kHz Tone, Symmetrical Distortion
Interestingly (and you may not have expected it), the 60Hz tone is also distorted by the circuit shown in Figure 6. Depending on whether there are one or two diodes connected, the distortion will be either symmetrical or asymmetrical. Remember that at any point in time, there is only one value of voltage, and the 60Hz and 1kHz tones are simply added together and become one single composite waveform. It doesn't matter if the 60Hz tone is visibly 'clipped' or not, because the composite tone comprises both waveforms which are now inseparable in a wide band system. That means that anything that happens to one, also happens to the other. The distortion of the 60Hz tone is comparatively low compared to the AM and distortion of the 1kHz tone, and it measures 0.5%. That adds even more harmonics to the overall waveform, and with that comes even more intermodulation.
In Figures 10 and 11, there are clearly IMD frequencies well below 1kHz, and these are products of the distortion of the 60Hz tone. As more harmonic frequencies are added, the IMD becomes more and more complex, and with material containing a multiplicity of different frequencies (which still only result in a single voltage at any point in time!), the IMD products become overwhelming and turn the music into 'mush'. There is one way (and only one way) to minimise this, and that's to ensure the amplifier is as linear as possible. Like it or not, that means it will have low measured THD. As noted earlier, THD and IMD go hand-in-hand, and it's not possible to have one without the other.
In any 'real' amplifying device, there should normally be no significant non-linearity while the amplifier is in its linear range. For designs with little or no feedback, non-linearity is guaranteed, because there is no single discrete active component that has perfect linearity. At very low signal levels (compared to operating voltage) the degree of non-linearity is generally quite small, and can be well below audibility. In general (at least with single-ended circuits), as the signal level increases, so too does non-linearity. The transfer curve of an ideal amplifying device is a straight line, with no discontinuities. In reality, the transfer curve is never a simple straight line, it's always curved. It doesn't matter if it's a valve (vacuum tube), transistor, FET or MOSFET, none has a perfect transfer curve.
The graph only shows the low-level performance, but any amplifying device will also reach saturation at some point. As the current increases, the gain falls, so there is non-linearity at both low and high output current. Once any amplifying device is fully saturated, further increases at the input make no difference, as it's fully turned on. This is clipping. There must be some mechanism to prevent solid-stage devices from over-current conditions that will damage the device or the power supply. The minimum 'resistance' for valves is usually quite high, and damage is less likely (it can still happen though).
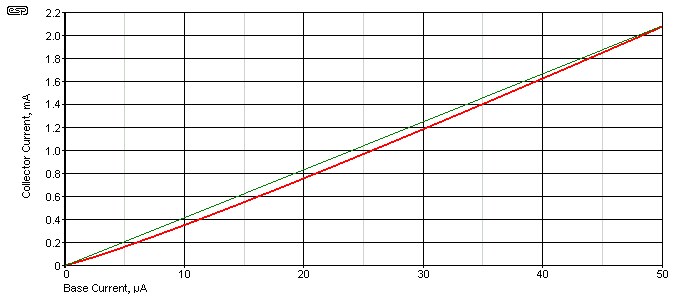
Figure 12 - Transfer Curve, 2N2222 Example
The red curve shows the actual transfer curve, and the narrow green trace shows the ideal straight line. Even though the non-linearity seems pretty small, it's there, and as such shows that the circuit will cause distortion. The red trace was obtained using the most ideal conditions possible. The collector voltage remains fixed at 12V, and the base current is derived from an 'ideal' current source. In any real circuit, the conditions are worse, as is the non-linearity. Even though it may appear that the upper part of the red curve is straight, it's not. There is a continual but slight curvature over the full range of collector current.
Despite the very gradual curve you see, if biased with 30µA and supplied with a 10mV input signal to the base, that results in a 3.7mA (peak to peak) collector current variation. The distortion is then almost 5%. This is improved by feeding the base with a variable current rather than a voltage, but with the same (as close as I could get it) collector current variation. Doing so reduces distortion to 0.15%, demonstrating the importance of topology when maximum linearity is essential. This article is not going to investigate ways to obtain maximum linearity - that's an altogether different topic, but it does show that even a small curvature in the transfer curve can result in surprisingly high distortion. Where there is harmonic distortion, there is also IMD.
Valves are actually worse than most transistors (as seen in any valve datasheet), as are JFETs and MOSFETs. It's a myth that "valves are more linear than transistors" - oft quoted, but wrong. The difference is that they (usually) operate over a smaller range of their operating voltage than transistors, but that doesn't help at all with power stages which have a great deal more non-linearity than modern power transistors. There are many ways that are used in project and commercial amplifiers alike that ensure that transistor linearity is well within the range where open loop (i.e. without feedback) gain is good enough to ensure low distortion, and when feedback is applied this improves both harmonic and intermodulation distortion figures. These aren't just numbers - they are essential figures for any amplifier, especially IMD.
Modern design practices (well, they aren't really that modern any more) result in pretty good linearity before the addition of feedback. Power transistors are now much better than they were even 10 years ago, with linearity that's far better than earlier devices. This makes it comparatively easy to design an amplifier that has a low open-loop (before feedback is applied) distortion, and feedback improves that to the point where distortion is (usually) not an issue. Combined with a good overall design that can still be surprisingly simple, it's rare for amplifiers to have distortion (THD/ IMD) that is audible.
By using bi-amping (or even tri-amping), each power amp has reduced power demands and a narrower bandwidth, which can also improve IMD. This is another tool in one's arsenal that can be applied to a system to get the maximum linearity. There are countless amplifiers (and opamps) that are so good that they test the limits of analysis systems, so unless your favourite amplifier is a zero feedback design or a single-ended triode, then IMD is usually not a problem. This doesn't mean that all amplifiers are free of IMD or even particularly low THD, but it's rare for any competent design to have audible flaws.
Early transistor amplifiers often had crossover distortion, where the signal becomes distorted as it passes from one output transistor to the other. This is particularly insidious, because distortion was nearly always measured at close to full power, and the effects of crossover distortion are most objectionable at low power levels. When neither output transistor is conducting, the amplifier has extremely low open loop gain (it can even be negative), so feedback cannot remove this type of distortion. This gave transistor amps a bad name compared to valve amps of the era, and some people still use this as the reason that valve amps sound 'better'. They don't. They often do sound different, but 'different' is not equal to 'better'.
Reviews may lead you to believe that one amplifier is "markedly superior" to another, but they are generally full of hyperbole, terms and phrases that have no meaning in engineering (or no meaning at all in some cases). Since most reviews are based on sighted tests (not blind or double-blind), the results are pretty much meaningless. Listening tests are important, and so are measurements. Ideally, the two will be in agreement, and if both are conducted sensibly, that will almost always be the case. It's very rare that an amplifier measures badly but sounds good, and the converse is also true.
It's worth a short paragraph to discuss an amplifier's 'linear region'. An amplifier that's clipping is outside the linear region because the output voltage cannot exceed the supply voltage. Feedback is irrelevant, because the output is not a linear function of the input voltage. If the input voltage to an amp changes so quickly that the amplifier is subjected to slew-rate limiting, then again, this cannot be corrected by feedback. The linear region is where the amplifier's output voltage is in direct proportion to the input voltage, and where the feedback path ensures that the error amplifier (the input stage) has almost identical voltages at each input. Most amplifiers spend most of their time in this linear region (there are exceptions of course).
All amplifiers (including opamps) have a frequency response that's tailored to ensure stability. That almost invariably means that while the gain at DC or low frequencies is very high (it may be more than 100dB for some opamps), as the frequency increases, gain decreases. As the gain decreases, there is less negative feedback, so it is less able to reduce non-linear distortion. What that means for the circuit is that distortion rises with increasing frequency, simply because there is less feedback (closed loop). Since distortion of all forms is directly related to the feedback ratio (i.e. the difference between open loop and closed loop gain), as the open loop gain falls, distortion must rise.
Fortunately for most audio applications, the frequency where this starts to have any real impact is generally well outside the audio band. However, it also depends on the amount of gain set by the feedback loop itself, and expecting very high gain from a single opamp (for example) can lead to unexpectedly high distortion at the top end of the spectrum. In some cases, people have claimed that this is 'proof' that feedback is 'bad' and ruins the sound, but countless commercial (and DIY) amplifiers show performance levels that exceed the ability of basic test equipment to measure any 'defects' - real or imagined. Some opamps are so good that even the best laboratory grade instruments struggle to measure their distortion, be it THD or IMD. In many cases, there is certainly the possibility that high-order IMD (and THD) products are greater than lower order distortion, but it's often the case that these supposedly 'troublesome' high order harmonics and/ or IMD products are below the noise floor.
There is no doubt at all that we can hear tones that are well below the background noise, but not if they are at 25kHz or more! Provided all harmonic and non-harmonic distortion components are either well below the noise floor and/ or are at frequencies above 20kHz, we don't need to be concerned. The situation is different if one is designing ADSL line drivers or other circuits that operate at low radio frequencies, and likewise if designing RF transmitters. Audio is neither of these, but it does present some unique difficulties of its own.
Most RF equipment is narrow-band, and even relatively wide-band equipment may only cover a range of a small fraction of an octave. Audio operates over a range of ten octaves, so the tricks that are used for RF equipment can't be used. However, audio equipment can be considered 'mature', in that the principles have been well known and (at least reasonably) well understood for close to 100 years. In that time, circuitry has been refined over and over again, with major manufacturers producing semiconductors that are close to being as good as one can get. This may continue to improve, but the rise of digital signal processing (DSP) and Class-D amplifiers means that there are significant changes to the way audio is processed.
TIM (transient intermodulation distortion) (aka TID - transient induced distortion) has been the topic of considerable research, and although it's now considered to be largely irrelevant, it's certainly possible to re-create it quite easily. First proposed in 1976 in a paper presented to the AES (Audio Engineering Society), it's very existence has been called into question. The original test stimulus proposed was a 3.18kHz squarewave, and a 15kHz sinewave, with a ratio of 4:1 respectively. The squarewave is provided via a low-pass filter, with a -3dB frequency of 30kHz or 100kHz "depending on quality requirements of the equipment being measured" (sic). While it's hard to criticise the authors for their enterprise, it should be apparent to most readers that the test is particularly severe, and doesn't represent the structure of 'normal' musical programme material.
It's not my intention to cover this in great detail, largely because I believe the test conditions proposed to be so far outside the normal parameters of audio signals that the results are not a reliable test for amplifier 'sound'. For any amplifier to be classified as 'low TIM', it requires not just high linearity, but far greater speed than is actually necessary to ensure high fidelity reproduction. This makes an amplifier more complex, but more importantly, it may have marginal stability due to the requirement for a wide open-loop bandwidth and high slew rate. Neither is necessary for an amplifier (or preamplifier) that is expected to handle frequencies up to 20kHz of 'normal' programme material. If an amplifier has wide bandwidth and a high slew-rate without compromising stability, then there is no reason to avoid it.
There is no doubt whatsoever that many opamps and power amps will provide apparently 'dismal' performance when subjected to the TIM test methodology, but there is no actual requirement for them to be able to handle such a severe test. The use of a squarewave is always a good test of an amplifier's performance (and one that I routinely use), but expecting normal audio circuitry to handle a signal that isn't created by any known musical instrument is not really a fair test. The more conventional IMD tests that are used are a better predictor of performance than a test that subjects the DUT (device under test) to operating conditions that are far outside the bounds of realistic audio.
It's worth considering that few (if any) mixing consoles or other elements in the recording chain have been verified as 'low TIM', nor have the majority of DACs (digital to analogue converters) or ADCs (analogue to digital converters). The LM4562 opamp (one of the lowest distortion opamps around) has specifications for just about everything, in particular THD and IMD. TIM is not mentioned. Whether it's because it's considered irrelevant or is below the measurement capabilities of the National Semiconductor (now Texas Instruments) laboratory is not known.
The net result is that TIM can certainly be induced in many circuits, but the parameters are so far beyond what is actually necessary for good sound reproduction that it's not a test that needs to be performed. Provided THD and IMD are within reasonable limits, the chances of 'serious degradation' of the signal can be considered negligible. Quite obviously, any circuit has to be fast enough to remain within its linear region for any audio programme material, and if that is achieved then nothing more needs to be done.
The TOI (third order intercept) is often quoted for RF equipment (transmitters etc.). Because the IMD ratio depends on the power level of the fundamental input tones, this is a useful test to determine how much power can be delivered before results are unsatisfactory. The fundamental principle of TOI is that for every 1dB increase in the power of the input tones, the third-order products will increase by 3dB.
As the power of a two tone stimulus is increased, the IMD ratio will decrease as a function of input power. At some arbitrarily high input power level, the third-order distortion products would theoretically be equal in power to the fundamental tones. This theoretical power level where first-order (fundamental/ stimulus) and third-order (IMD) products are of equal power is called the third-order intercept.
This is not relevant to audio applications, and is mentioned here purely because it's a term that you'll come across when looking for information on IMD. There are many other terms you may also come across for RF applications, but they are 'application specific', and not something you need to be concerned about. Searches will bring up a lot of information, and it can be difficult to work out which things you need to know vs. those that are irrelevant to audio frequency amplifiers.
Intermodulation distortion is without doubt the most complex form of distortion in any amplifying equipment, and is the most difficult to understand. Measurement isn't easy either, because test equipment that's generally well out of range for hobbyists is required. There are several test systems that can do a very good job, but ideally you still need a good notch filter to remove the low frequency component. Without that, it can be very difficult to see intermodulation products clearly, because the range of most affordable test gear is not great enough to be useful. Most digital oscilloscopes have an FFT (fast Fourier transform) function, but it lacks the range and precision necessary to be able to identify IMD unless it's so high as to be audible.
IMD often pales into insignificance compared to that created by some loudspeaker drivers, with 'full-range' speakers being one of the worst because they have to handle the entire frequency range. Some people have worked around this by horn loading the driver for low frequencies, but bass horns are impracticably large for most listening rooms. Usefully, while loudspeakers in general have much higher distortion levels than most amplifiers, the effects are generally low-order because the drivers are generally used over a relatively narrow bandwidth. Even wide range drivers can sound very good, provided power levels are modest.
IMD is far more difficult to measure and quantify accurately than 'simple' THD, but you can generally rest assured that if the THD level is sufficiently low, IMD is unlikely to be a serious issue. Despite all the claims that harmonic distortion measurements are 'pointless', they are nothing of the sort. Low THD means high linearity through the circuit, and if a circuit is sufficiently linear it's unlikely to generate serious IMD. There are factors that can change this, as linearity can deteriorate at higher frequencies (which may not be measured for THD). In general, if you get a good THD figure at 1kHz and low IMD with an SMPTE and/or ITU-R test, then it's time to listen critically to ensure that the measurements and what you hear are in agreement. Few amplifiers will disappoint if they provide good test results.
 Main Index Main Index
 Articles Index Articles Index |