
|
|
| Elliott Sound Products | Project 52 |
Total harmonic distortion (THD) measurements are one of the most commonly quoted in audio. Contrary to belief in some circles, these can be very useful if performed properly, and reveal much about the overall performance of an amplifier. The correct (and full) title is THD+N - total harmonic distortion plus noise, because the notch filter cannot remove noise (other than at its exact frequency), and the residual output must contain both noise and distortion products.
There are a number of ways to measure distortion, none of which is perfect. Probably the best is a spectrum analyser, which shows the individual harmonics and their amplitudes. These are too expensive for the likes of you and me (well, me, anyway) and the next best thing is featured here. While most digital oscilloscopes have FFT (fast Fourier transform) capabilities, this is unusable for anything other than gross distortion, because the scope doesn't have sufficient resolution (most have only 8-bit analogue to digital converters).
There are other methods as well, one of which is to subtract the output of an amplifier from the input (with appropriate scaling). When the two signals are exactly equal and opposite they are cancelled out - any signal left is distortion created in the amplifier. This method seems easy, but is not, because there are phase shifts within the amp that can be very difficult to compensate for exactly, and the final accuracy of tuning the parameters - amplitude and phase - must be just as great as with this circuit for a meaningful result.
All analogue distortion meters rely on a notch filter. There are several options that have been used by various test equipment makers, including the Twin-T (used here), Wien bridge (preferred by Hewlett Packard) and a far less common version using phase-shift networks. A state-variable notch filter can also be used (see State Variable Filters for details. The type of notch filter doesn't affect the readings, provided the notch depth is great enough. A minimum requirement is to be able to reduce the fundamental by at least 80dB, allowing a reading down to 0.01% THD + noise. This is easy enough to achieve, but high stability parts have to be used or drift will make a measurement very difficult. See Stability below.
The design shown uses a Twin-T (aka parallel tee) notch filter with feedback, and with good opamps (and other parts) it can achieve better than -100dB rejection of the fundamental. Feedback is required to ensure that the second harmonic isn't reduced. Without feedback the 2nd harmonic is attenuated by over 9dB for a passive Twin-T filter, and the 3rd harmonic is reduced by 5dB. This is not acceptable, because these lower harmonics are often the major components of the total distortion.
As noted in the intro, the standard tool for measuring THD is a notch filter. This is tuned to reject the fundamental frequency, and any signal that gets through is a combination of the tested amplifier's noise (including any hum) and distortion. The distortion shows up as a signal that is harmonically related to the signal fed into the amp, but is not the fundamental. Harmonics occur at double, triple, quadruple (etc) the input frequency. These are referred to as 2nd, 3rd, 4th (etc.) harmonics, and are subdivided into odd and even. Even harmonics (2nd, 4th, etc) are claimed to sound better than odd (3rd, 5th, etc), but in reality we don't want any of them.

The filter of Figure 1 is 'normalised' to 1µF and 1kΩ, giving a frequency of 159Hz. The resistor and capacitor ratios are extraordinarily critical if a deep notch is to be obtained, and this is essential for distortion measurement. This notch filter is called a Twin-T, and works by phase cancellation of the input signal. When the phase shift is exactly +90° and -90° in the two sections, the tuned frequency is completely cancelled, leaving only those signals that are not tuned out. This residual signal represents total harmonic distortion + noise.
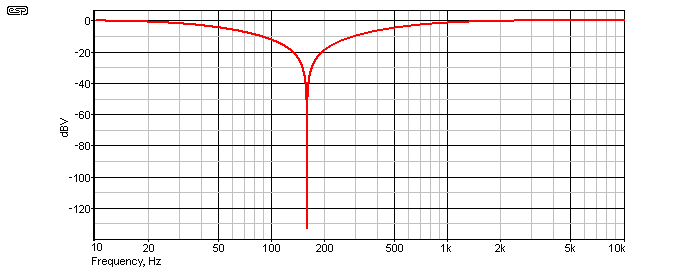
The problem with the notch filter shown is that its attenuation is too high at the 2nd harmonic, and in fact is only acceptable one decade from the fundamental. The example shown has about 0.7dB attenuation at 1.6kHz - a decade from the 159Hz fundamental frequency. This is corrected by using feedback, which tries to get rid of the notch, but is completely unsuccessful, since when properly tuned the notch is infinitely deep.
Too much feedback, and the filter will be be almost impossible to tune because it is too sharp, so a compromise is needed. We need the filter to cause no more than a dB or so of attenuation at double the fundamental frequency (this is one octave), to prevent serious measurement errors of second harmonic distortion.
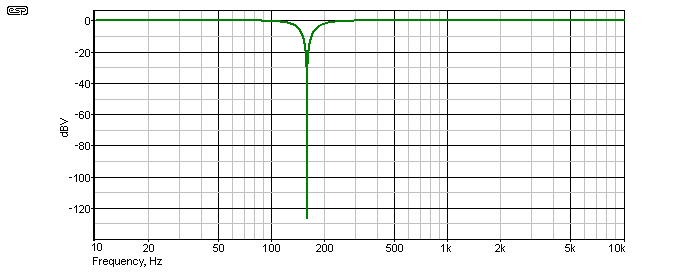
Figure 3 shows the result when we apply feedback, and the error at one octave is now less than 1dB. This is acceptable for normal measurements, and the resulting error is small, while retaining the ability to tune the filter. Note that although it is tuneable, this filter is still extremely sharp, and unless multi-turn pots are used it will be almost impossible to obtain a good notch. The slightest variation of the input frequency will create a massively high 'distortion' figure. I have found that with very low distortion amps, it is a real battle to measure the distortion whilst trying to keep the filter tuned, because of drift.
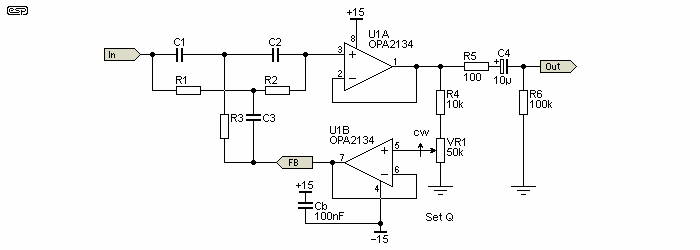
This overall characteristic is the desired one, so the final notch filter design is shown in Figure 4, with the feedback applied from the opamp. I have chosen to make the feedback adjustable, so that you can easily modify the characteristics if you want to. This can make it a little easier to tune, since initial tuning can be done with a small amount of feedback, and as the exact frequency is tuned in, the feedback can be increased.
Once upon a time, it was possible to obtain 50k+ 50K+ 25K wirewound pots (I think that was the range) - yes, a triple gang, two separate resistances, wirewound pot! These were especially for just this type of circuit, but I doubt that you will find one any more. The only way that multiple frequencies can be tested is to use a switched selector, and ensure that there is enough range in the tuning pots to make up for all capacitor value errors.
The accuracy of tuning is critical - a 40dB deep notch will show the distortion as 1%, even though it may be much less. A 60dB notch reduces this to 0.1% and so on. For a 100dB notch, you will need all components accurate to within 10ppm (parts per million or 0.001%). A -100dB notch lets you measure 0.001% THD. Even a small temperature change can send the meter needle (or oscilloscope trace) straight off the scale. I know this, because it happens every time I try to measure very low distortion levels, and I can't get to 0.001% on my meter because my oscillator has more distortion than that. I also can't measure the output voltage because it's only 10µV for a 1V input.
To change ranges, we must vary either the resistance or capacitance (or both). Figure 5 shows the range switching. To try to keep the unit reasonably versatile, I have included two switches. SW1 gives decade ranges of 20, 200 and 2kHz by changing capacitor values. SW2 gives the standard 1, 2, 5 sequence common in oscilloscopes. This combination allows the following frequencies to be tested ...
| Range 1 (SW1) | Range 2 (SW2) | Nominal Frequency |
| 20 | x1 | 20Hz |
| 20 | x2 | 40Hz |
| 20 | x5 | 100Hz |
| 200 | x1 | 200Hz |
| 200 | x2 | 400Hz |
| 200 | x5 | 1kHz |
| 2k | x1 | 2kHz |
| 2k | x2 | 4kHz |
| 2k | x5 | 10kHz |
The notch frequency is determined by
fo = 1 / ( 2π × R1 × C1 )
Resistor values are exactly R1 = R2, R3 = 0.5 × R1
Capacitor values are exactly C1 = C2, C3 = 2 × C1
The tuning requires that the ratios are exact - absolute values are not as important, but they must be stable. To be able to tune the notch precisely, we will use pots in series with two of the resistors, R1 and R3. The range of the pots will vary depending on the resistance that is switched into the circuit, and even with multi-turn pots it is useful to have two in series, one with a lower resistance than the other. This is shown in Figure 5.
It is essential to make sure that the pots have enough range to compensate for the tolerance of the capacitors, and some care is needed to keep wiring capacitance to a minimum, especially for the highest frequency range. To this end, I suggest that all tuning components are wired directly to the switches and pots, and that wiring is done with solid tinned copper wire. All wiring can be made self supporting, and will exhibit very low capacitance.
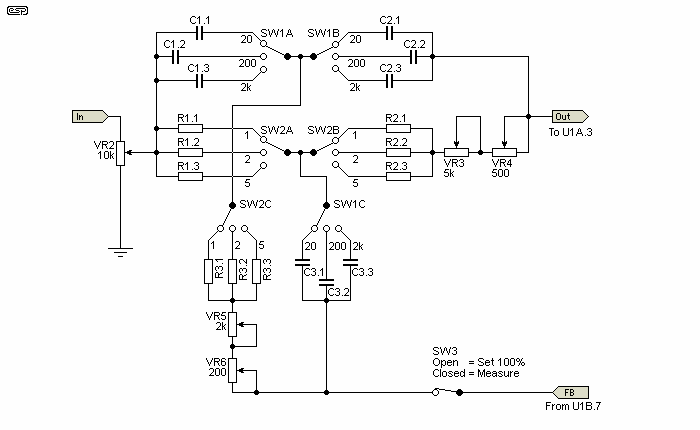
The range switching simply connects different resistors and / or capacitors into the circuit. A problem is that when resistances are changed, the sensitivity of the tuning pots also changes. This is unavoidable unless you can get odd value triple-gang pots (Do you feel lucky? - If you find them, buy a lottery ticket!). VR4 and VR6 should be multi-turn - you can get geared pot drives to use standard pots if multiturn units are unavailable.
The set/ measure switch (SW3) must have the lowest possible contact resistance. It will ideally be a double-pole switch, with both sets of contacts in parallel.
The values and exact design frequencies are shown in Table 2. To make the C3.x values, parallel two C1.x value caps, and if possible use a capacitance meter to match all capacitors to within 1%. Standard tolerances will affect the centre frequencies. Resistors should be be metal film, 1% tolerance, and from the E24 series (24 values per decade). The values of R2.x and R3.x are lower than expected, because I have taken the mid resistance of the two series pots into consideration. Note that some of the resistors require 2 components in series to get the desired resistance.
| Frequency | C1.x, C2.x | C3.x | R1.x (Ω) | R2.x (Ω) | R3.x (Ω) |
| 19.4 Hz | 100nF | 200nF | 82k | 75k + 4.3k | 39k + 1k |
| 40.8 Hz | 100nF | 200nF | 39k | 36k | 18k + 390 |
| 99.5 Hz | 100nF | 200nF | 16k | 13k | 6.8k + 100 |
| 194 Hz | 10nF | 20nF | 82k | 75k + 4.3k | 39k + 1k |
| 408 Hz | 10nF | 20nF | 39k | 36k | 18k + 390 |
| 995 Hz | 10nF | 20nF | 16k | 13k | 6.8k + 100 |
| 1.94 kHz | 1 nF | 2nF | 82k | 75k + 4.3k | 39k + 1k |
| 4.08 kHz | 1 nF | 2nF | 39k | 36k | 18k + 390 |
| 9.95 kHz | 1 nF | 2nF | 16k | 13k | 6.8k + 100 |
Note that values shown in italics and on a light grey background are simply repeats of parts already specified. They are not separate individual values.
There are a couple of things to be aware of with this circuit. Firstly, the input impedance is quite low, and use of a buffer is not recommended because this will introduce additional noise and distortion. The opamps used for the feedback should be the best you can get hold of. The Burr-Brown OPA2134 is an excellent choice, with 0.0003% distortion and low noise. Other devices that will be suitable include the venerable NE5532, LM4562 or OPA2604.
To allow power amps to be tested, an input level control is needed, and this is also used for calibration. The control ideally should be a wirewound device since power dissipation could be quite high, and wirewound pots add less noise than carbon. If high power amps are to be tested, add a suitable attenuator network before the pot, using (for example) a 1k 5W resistor and a 100Ω 1W resistor to ground. That combination will let you test amps with over 50V RMS output (312W into 8Ω). The attenuator must be before the 10k pot.
The ideal measuring meter is an oscilloscope, but a millivoltmeter may be used. Without the oscilloscope you will be unable to see the 'quality' of the distortion components, but use of an amplifier will allow you to listen to the residual - make sure that you have a limiter circuit on the monitoring amp, or a slight bump of the oscillator frequency control will blow your head off! A suitable limiter is published as Project 53. Modern digital oscilloscopes are a good choice, because most provide extensive maths functions that will let you perform a FFT (fast Fourier transform) of the output, or an accurate RMS measurement.
The final measurement will include the distortion from the audio oscillator, and it is likely that this will be greater than that of many amps. It is not really possible to tell you how you can subtract this from the measured distortion, since the distortion waveform has a huge influence over the result. The distortion waveform is very important - a low average level spiky waveform (typical of crossover distortion) will sound much worse than an apparently higher level of 'clean' 3rd harmonic distortion from a well designed push-pull amplifier stage.
If you were to obtain a final reading of (say) 700µV, you can now determine the distortion + noise.
THD% = ( V2 / V1 ) × 100 Where V1 is the initial voltage and V2 is the lowest reading
THD = ( 0.0007 / 3 ) × 100 = 0.023%
 |
Remember that if you apply too much signal to the input, you will destroy the opamp. The use of protection diodes is not an option (IMO), as this will introduce distortion, making your measurements useless. The distortion introduced by the analyser may exceed that of a good amplifier. This is unhelpful! |
The distortion meter circuit can be simplified. For example, you may feel that there are more ranges than you need, and these can be adapted for your needs. You might even think that a single range is sufficient, and for many basic tests this is OK. Naturally, you will be unaware of distortion that may become apparent only at low or high frequencies - but I shall leave this up to you.
The traces below show the fundamental (green) at 707mV RMS, some deliberately introduced odd-order harmonic distortion (red) and even-order distortion (blue). Note that there is no evidence whatsoever of the original 159Hz fundamental - the notch filter has removed it completely. Anything left over has been added to the original signal, and is therefore distortion.
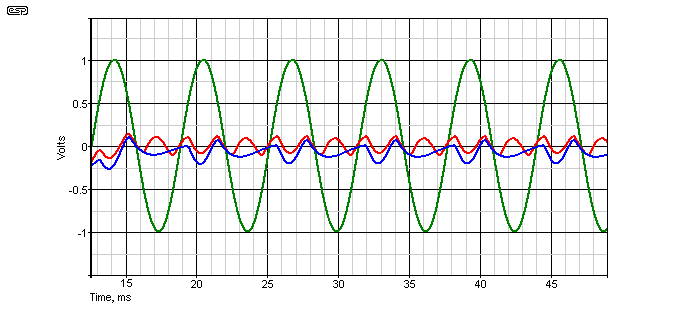
The distortion voltages were amplified by 100 times for clarity. The odd-order distortion measures 40.81mV (408.1µV when divided by 100), and even-order distortion was 33.05mV (330.5µV also divided by 100) - remember, the displayed and measured distortion was amplified by 100 and are RMS values. The discontinuity at the beginning of the waveforms (which start at 12.5ms rather than zero) is because of the notch filter. Because it has a high Q, the waveform suffers from considerable transient distortion when the signal is applied, and the last remainder is visible on the trace.
Using the formula above, distortion can be calculated ...
THD% = ( 408.1µV / 707mV ) x 100 = 0.058% (odd-order)
THD% = ( 330.5µV / 707mV ) x 100 = 0.047% (even-order)
Distortion was created by the simple circuit shown below. Since the graph shown is from a simulator, it was necessary to add distortion because the simulator's output waveform is a perfect sinewave, and it has no distortion. You can do the same with 'real' circuits. Note that the distortion calculated by the above formula will not be the same as that shown by a distortion meter. The accepted measurement is based on the rectified average of the distortion waveform, not RMS. This is unfortunate, but very few distortion meters use 'true RMS' measurements. The result is optimistic, especially with spiky waveforms (typical of crossover distortion).
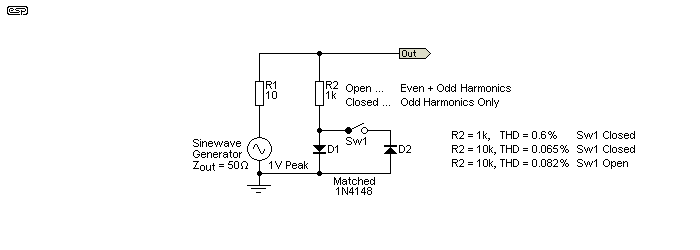
With an applied signal of 1V peak (707mV RMS), the distortion added is quite small as shown above. This is especially true when you consider that the signal is limited by a 10Ω resistor, and the diode distortion is applied via the 1k resistor. This amount of distortion is inaudible on a sinewave, and it will definitely be inaudible with a music signal (of the same peak amplitude of course).
When you use a real (as opposed to simulated) sinewave generator, R1 isn't necessary and R2 will need to be increased in value. This is because most signal generators have an output impedance of between 50 and 600Ω. Most sine oscillators will have distortion figures that are well within the measurement range of the distortion analyser, so expecting to be able to measure much below around 0.02% THD is generally unrealistic. The figures given in Fig. 7 were simulated, using the values shown, with R1 at 1k and 10k. Even with a ratio of 60Ω (assuming a generator with 50Ω output impedance) to 10k between the total feed resistance and the diodes, the distortion levels are easily measured.
To give you an idea of any circuit's linearity, If you build the circuit shown above (Fig. 7) using a 5k series resistor and a 1MΩ resistor to the diode (a 1:200 ratio), with a single diode the distortion will be around 0.088%. The distortion output from the notch filter is 639µV for a 707mV input. If you add another diode (with reversed polarity) the distortion falls to 0.037%, with an output voltage of 266µV. This should give you an idea as to just how good most amplifiers (and especially opamps) really are. The LM4562 is specified for a distortion of 0.00003% (typical).
It's important to understand just how deep the notch can be, and make allowances for oscillator stability. When perfectly tuned, a twin-tee notch filter can provide 80dB or more rejection of the signal frequency, depending on the opamps used. In theory, a notch of greater than 110dB can be achieved. Even with only 80dB, this means that tuning can be incredibly difficult, especially if the oscillator frequency or notch filter components drift. The capacitors you use are important, and the ideal is polystyrene (hard to find and expensive). You can also use polypropylene, which are more stable than Mylar/ polyester.
The resistors (including pots) will also have some drift, and if you have a notch depth of over 80dB, the bandwidth at the -80dB level is about 42mHz (that's 0.042Hz). Everything makes a difference, and they all conspire to make your life harder than it should be. Most distortion analysers that can measure below 0.1% use an auto-nulling system, usually with LED/LDR optocouplers driven by additional circuitry to detect the amplitude and phase of the distortion residual and make corrections in 'real time'.
These auto-nulling systems have limited range, so the user has to adjust the main frequency and null controls manually. Once a reasonable null has been found, the automatic circuitry takes over and completes the nulling process. The final depth of the null is determined by the gain and accuracy of the detector circuits. If these instruments are supplied with a particularly clean sinewave, the distortion residual will usually still have some of the fundamental present, indicating that the amplitude/ phase detectors are at their limits.
Suitable circuitry is complex, and it's not something I'm prepared to tackle. You can always read service manuals for commercial distortion measurement systems to see how they do it, and should you do so you'll quickly discover that it involves far more circuitry to perform auto-nulling than the notch filter itself. While an auto-nulling system can eliminate the effect of a small oscillator frequency shift, you still need a very stable oscillator or distortion readings will be too hard to keep steady.
Another factor that limits the ability to measure extremely low distortion is the gain of the metering amplifier. With an input voltage of 1V RMS, if you wish to measure down to less than 0.01% (not wonderful, but generally alright), the metering amplifier has to be able to measure down to 100µV full scale for an input of 1V. That's not easy to accomplish, because even quiet opamps (whether integrated or discrete) will have noise that becomes significant at such low levels. In order to minimise the noise, the circuitry has to be low impedance. Consider that a 100kΩ resistor - by itself - generates 57.4µV of noise at 25°C with 20kHz bandwidth, and that's with no amplification at all. A 'perfect' (completely noise-free) amplifier with a gain of 100 (40dB) will raise that to 5.74mV, and you're trying to measure 100µV full scale. Good luck with that. 
The challenge is fairly obvious. One solution is to increase the input voltage, but it cannot be greater than the notch filter opamps can handle, and if you add gain at the input, the circuitry must be extremely linear (and also low noise) or you may end up even worse off than when you started. Measuring very low distortion will always be difficult, and doubly so if you try to develop your own solution. Test equipment manufacturers have battled with these issues for years.
To measure distortion to 0.1% requires a meter amplifier with 60dB gain (×1,000). If your input signal is 3V RMS, you need to be able to measure 3mV full-scale to measure 0.1% THD. Lower input voltages mean that you will need to add some gain somewhere. To measure 0.01% THD, the metering amp requires a sensitivity of 100µV full-scale for 1V input. This is challenging, because you're measuring voltage levels normally only found with moving-coil phono pickups. The requirement for high input impedance makes this much harder than it is for low-impedance sources.
I recently decided to resurrect my old distortion meter, and after dismantling it I found that I'd been able to locate (at the time it was built) a 30k + 30k + 15k wirewound pot. This was used for coarse tuning, and it allowed me to build a meter that could cover all frequencies within the audio range. I mention this only because it's obvious that such a part would be completely unobtainable today, because almost no-one builds their own test gear any more, and there are virtually no affordable commercial products built either. The only way to get a distortion meter today is to buy one second-hand, or build it yourself.
It's also worth noting that traditionally, THD has (nearly) always been measured using an average-responding meter, calibrated to RMS. This leads to some inaccuracies, because the RMS measurement is only accurate with a sinewave. If the distortion residual is anything other than a sinewave (which is never the case), the reading will be wrong. Just how wrong depends on the waveform itself, and there are no 'conversion factors' that can be used. This is why it's so important to look at the distortion residual on an oscilloscope, as you can see things that the meter doesn't respond to.
 Main Index
Projects Index Main Index
Projects Index
|