
|
| Elliott Sound Products | Power Calculations |
Copyright © 2017 - Rod Elliott (ESP)
Page Created 16 January 2017
 Main Index
 Lamps & Energy Index
Power calculations can be tricky, especially with mains appliances that represent an inductive or nonlinear load. Some might show a capacitive load, but this is very uncommon, and is most likely only to happen with very low power devices. As noted in the pages that discuss Power Factor, this is an area that is widely misunderstood, and to some extent, so is power itself.
Most power meters available (other than the now more-or-less obsolete electro-mechanical kWh (kilowatt hour) meter in a switchboard) are digital, and the newcomer (or even experienced engineer) may wonder how you can calculate the actual power as opposed to the seemingly simpler VA (volt-amps). The latter is simply the product of RMS voltage and RMS current, but that's VA, not watts. The two can be very different depending on the load.
This short article explains how it's done, using both analogue and digital techniques. Note that there is no code for micro-controllers or the like - only the general principles are discussed. Ultimately, it's going to be far cheaper to buy a ready-made wattmeter. Project 172 shows a typical commercial product that costs less than the IC alone for an analogue wattmeter. Likewise, only a very basic conceptual circuit is shown for an analogue meter, and the principles are not changed for digital systems. The multiplier IC is simply replaced by ADCs (analogue to digital converters), usually within the micro-controller itself.
To see the process involved in calculating RMS values from a sampled waveform, see Application Note AN012 in the ESP app. notes section.
So, to measure 'real' (i.e. actual power, not VA) what needs to be done? It's actually simpler than you might think. The voltage and current are simply multiplied together, using the instantaneous value of each. The output is then averaged, and the result is true power. This happens on a continuous basis with an analogue multiplier (see below), and the output is averaged using nothing more than a resistor and a capacitor, or a moving coil meter movement which provides averaging due to its mechanical inertia.
In a digital system, the input voltage and current will be sampled. Each sample of voltage is multiplied by the sampled current, with the two samples typically displaced by a very small time period that won't affect overall accuracy. The samples are then averaged, usually by maintaining a 'running average' of several thousand data points. The average is calculated simply by adding each sample to an accumulator, and dividing by the number of samples.
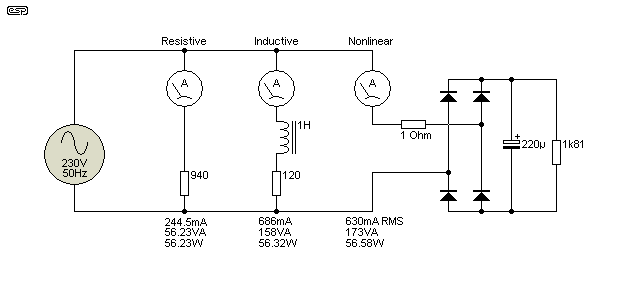
Now it's time to look at some examples. There are three different loads shown below, with each drawing as close as I could get to the same power. The loads are resistive, inductive and nonlinear. A capacitive load isn't shown because they are uncommon, but is the same as the inductive case, but with a leading power factor instead of lagging. Note the 1 ohm resistor in series with the nonlinear supply. This is included to ensure more realistic results, but it has little effect on the average load power.

Figure 1 - Load Circuits For Calculations
In the case of the resistive load, the waveforms are 100% uninteresting, being a pair of sinewaves (one for voltage, one for current) with perfect phase alignment. Because the load is resistive, power is calculated as the product of RMS volts and amps. While we could go through the procedures required for the other two loads, there's no point because we get the same answer however it's done. I'll be using one of the functions of the simulator I use (SIMetrix) to show what happens with the other two.

Figure 2 - Inductive Load Waveforms
You can see the phase difference above (red vs green trace), and the product of the two gives a power reading that passes through zero and becomes negative. This is a characteristic of all reactive loads, and if there is no negative portion, the load is not reactive. During the negative sections, power is returned to the supply - normally the electricity distribution system. The average value considers both positive and negative values, and the average is therefore 56W (close enough). The average is shown with a dashed line in the 'Power' graph.

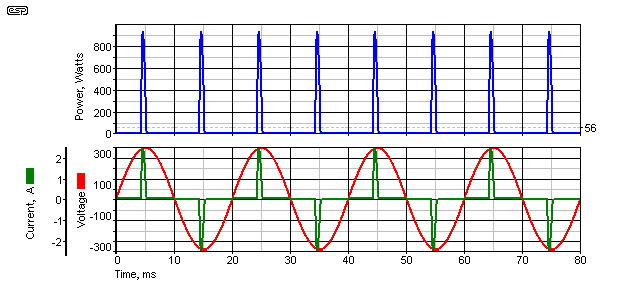
Figure 3 - Nonlinear Load Waveforms
The nonlinear waveforms shown are close to 'worst case', in that only a 1 ohm series resistance was used to simulate the mains impedance. In all cases there will be some resistance in the diodes, ESR of the capacitor and of course the resistance of the mains filters and other wiring. The peak current is 2.89A, with the current pulses lasting for about 1ms. Here, there is no phase difference, and measuring the timing of the current pulse with relation to the peak voltage is completely pointless and provides exactly zero useful information. I have seen test reports where it's been included and claimed to be 'leading', but this is drivel, and simply shows that the engineer is talking through his hat (i.e. has no idea what s/he's talking about). The average is again shown with a dashed line in the 'Power' graph.
When the two waveforms are multiplied together, the result (power) is either zero or positive. The conditions for a reactive load are not satisfied, as this requires that some power will be returned to the source (negative power). A nonlinear circuit does no such thing. The average power is 56.52W. This type of current and power waveform is important to understand, because it often causes errors, not only with analogue solutions but digital as well. The problem is the very large peak value - for power, the peak is 931W for an average of 56W (a ratio of more than 16:1). Current isn't much better, having a peak of 2.89A and an RMS value of 630mA (a ratio of almost 4.6:1).
These high peak values have to be processed by analogue electronics without causing overload. Within a microcontroller, there must be no clipping - including in the ADC (analogue to digital converter) or by causing overflow errors in the accumulation register. You need to ensure that the micro has plenty of bits of memory to be able to handle such large numbers.
Once upon a time, you could buy analogue multiplier ICs for sensible amounts of money. Now, most are frighteningly expensive, although there are still some lower cost options in SMD packages. While the idea is still just as valid as it ever was, the cost can't be justified. In addition, they will generally use an analogue moving coil meter, and must be calibrated against known accurate standard meters. Almost all wattmeters you see now are digital.
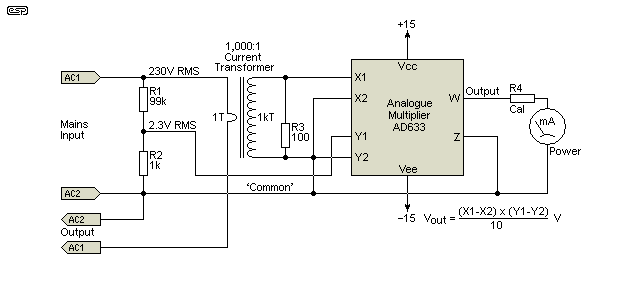
The principle of an analogue multiplier is simply that it has two (usually differential) inputs, and the output is the product of the two inputs (i.e. the instantaneous values are multiplied together). This also typically includes 'scaling' - the output may be the product of the two inputs multiplied by a scaling factor (commonly 0.1). So, if you provide one input with 5V and the other with 4V, the output will be 2V (20 divided by 10). This is done because the output can't exceed the supply voltage (typically ±15V). An example is the AD633, which has been around for a long time now, and is well suited to the task of making a power meter. DC offset must be controlled carefully, as this can be a significant source of errors.
To obtain the average value (power), you can simply use an analogue (moving coil) meter movement, which displays the average by its very nature. The movement itself is a potential source of error because few 'cheap' movements will have very high linearity. The human interpreting the value is a significant error source as well, due to the need to estimate intermediate values (amongst other reading errors).

Figure 4 - Basic Wattmeter Scheme
The circuit shown above shows how a basic wattmeter can be implemented. Voltage is measured using a voltage divider that reduces the nominal 230V (or 120V) AC to something within the range of the multiplier. As shown, it simply divides the voltage by 100, so 230V becomes 2.3V RMS (3.25V peak). Current is monitored with a current transformer. A common ratio is 100mV/A, so a current of 5A gives an output of 500mV (5mA through the 100 ohm 'burden' resistor). The output voltage from the current transformer must account for high peak values as shown in Figure 3. The circuit also performs perfectly with a lagging (or leading) power factor (i.e. one having phase shift between voltage and current waveforms). In a simulation, the analogue multiplier was within 1% of the power values calculated in figures 2 and 3.
Although this circuit shows an analogue system, the principles for digital are virtually identical - the analogue multiplier is simply replaced by a micro-controller with internal ADCs to read the voltage (at Y1) and current (at X1). These tell the code the instantaneous value of voltage or current at each sampling interval. Rather than a moving coil meter, the output of a digital system will be via an LCD or LED display. The input devices will be virtually identical, except they will be AC coupled to the microcontroller because they operate from a single (typically +5V) supply. Both inputs will also have to be reduced in level, because a 5V microcontroller usually can't handle voltages of more than 4V P-P (between 0.5V and 4.5V). This represents a maximum input voltage of 1.414V RMS.
The first step is to digitise the instantaneous value of voltage and current, then remove the offset from the ADC inputs (typically 2.5V DC). It may also be necessary to perform DC removal to account for offsets that are not exactly equal to the internal reference voltage. The offset value is not always 100% accurate, so it is usually necessary to monitor the inputs, determine if there is a DC offset, and remove it by subtracting the DC value from each sample. This will give (equal after averaging) positive and negative values for the sample, depending on where it's taken from the input waveforms.
Within the code, each sample of voltage and current is multiplied together, and the result stored in memory. After a selected number of samples, the average is taken. For example, if you add and store 100 multiplied samples, you divide the total value stored by 100 to obtain the average. It may be necessary to perform the averaging process in a couple of steps so that very large values don't have to be stored. Note that if the sample interval is too great, it may not be possible to obtain an accurate reading for pulse waveforms as shown in Figure 3.
So, you may take an average every 100 samples, then add those calculated averages into a second accumulator, then obtain the average of those at regular intervals. In all cases, the averages taken will be continuously moving, and a further averaging step may be needed to obtain a stable display. Not being a (professional) programmer, I won't try to be more specific on exactly how these functions are implemented, but a web search should find the full code for anyone who's interested.
Once the samples have been taken, it's an easy matter to calculate the RMS voltage and current along with the power, so the meter can display the following ...
RMS Voltage
RMS Current
'Real' power (Watts)
'Apparent' power (VA)
These functions cost nothing (apart from display 'real estate'), and it's an easy matter to include them in the code. Determining the true RMS values of voltage and current are much harder (and more expensive) using analogue techniques, although measuring power is relatively inexpensive. It's not surprising that all power meters you'll find today are digital, because all the functions (RMS voltage, RMS current, VA (volt-amps) and power) are easily programmable.
This article is intended to show how power is calculated, either in the analogue or digital domain. Electro-mechanical wattmeters are not included because few people even have access to one, and they are now considered obsolete. It remains to be seen if the new digital versions that are installed in new switchboards have the same longevity. The wattmeter at my home had been in continuous use for more than 50 years, and never failed in all that time.
The ability to determine true power (as opposed to VA) is critical, because we pay for watts. Industrial facilities may be penalised if their power factor is less than some figure prescribed by the electricity supplier. Residential customers are spared that indignity  (for the present - it might change now that it's easy to record all parameters).
The old-style electro-mechanical systems only react to power and can't record or display VA, but now that's changed with digital systems now taking (close to) 100% of the market.
 Main Index
 Lamps & Energy Index