
|
|
| Elliott Sound Products | Frequency & Amplitude Explained |
 Main Index
Articles Index Main Index
Articles Index
|
Introduction
Sound is carried from the source to our ears or a microphone by means of minute vibrations, which are passed through the air. Sound has two primary components, frequency and intensity. The frequency refers to the pitch of the tone or other sound, and typical sounds have many different frequencies all happening at once. Frequencies are measured in Hertz (Hz), named after the physicist Heinrich Hertz. The old standard (now discontinued almost everywhere) used Cycles per Second (cps) as the standard measurement. Hz and cps are the same thing - both refer to the number of complete cycles of a waveform in one second.
Sound intensity (or amplitude) is measured in decibels (dB). The prefix 'deci' means one tenth. The Bel was invented by engineers of the Bell Telephone Laboratory to quantify the reduction in audio level over a 1,600m (1 mile) length of standard telephone cable, and was originally called the transmission unit or TU. It was renamed in around 1923-4 in honour of the Bell Laboratory's founder Alexander Graham Bell. Because the Bel is too large for general use, the dB became the preferred unit. 1 Bel is 10dB.
The range of frequencies we humans can hear is generally taken as being from 20Hz to 20,000 Hz (20kHz), but the conditions are not usually specified. As we get older, the first to suffer are the high frequencies, and by around 50 years of age, most males will be limited to around 14-15kHz, with females usually suffering less loss. Frequencies below 25Hz are felt rather than heard, but the conditions under which we experience such low frequencies make a big difference to how they are perceived. At very low frequencies, there is little difference between the threshold of hearing and the threshold of pain, which can make low frequency noises especially troublesome.
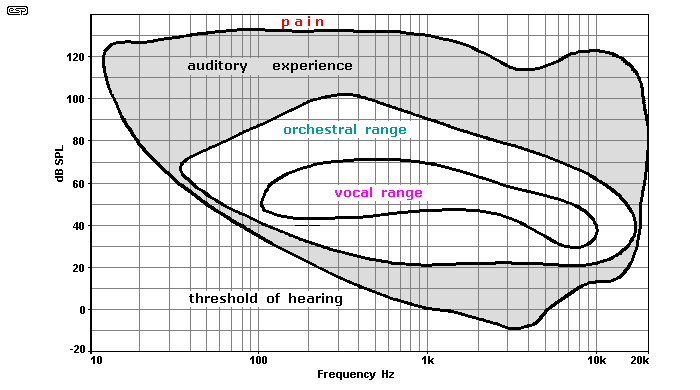
Our hearing is most sensitive at around 3.5kHz, as shown in Figure 1. Our hearing, eyes and sensitivity to touch or pain, are all logarithmic functions. This enables us to experience a vast variation with each sense. As the intensity of the sense increases, we automatically compensate by reducing our sensitivity. In this way, we can hear the gentlest rustle of a leaf in a tiny breeze at a sound pressure level (SPL) of 0dB, but are not instantly deafened by a nearby jack-hammer at perhaps 1,000,000,000,000 (1 trillion, or 1 x 10¹²) times the sound power (120dB SPL).
When two frequencies are close to each other, our hearing plays some interesting tricks on us. If one tone is 6dB louder than the other (but close in frequency), we may not hear the second tone. This is called acoustic masking, and is used by the MP3 format to remove a great deal of the 'redundant' audio information. This reduces the size of the file dramatically, and with some music the end result may be almost indistinguishable from the original. Material with rich harmonic structure is less successful, with cymbals and harpsichords suffering because there is simply too much information and none of it is actually redundant. It's also worth mentioning that all of the audible cues we use to hear a 'sound stage' are considered redundant by MP3 encoders, so much of the subtle stereo image disappears. Only material that's panned hard Left or Right will remain, and the sound stage is gone forever.
In (western) music, we generally use the equally tempered scale. While not absolutely musically accurate, it does allow musicians to make key changes (moving an entire piece of music up or down the musical scale) without having to re-tune their instruments. This is a vast topic, and requires a great deal more than you will find here if it is to be fully understood. Unless you are a musician, a full understanding is not required. An octave can be divided into equally spaced semitones ('notes') as described below.
Musical notation is based on the use of 12 semitones in each octave. An octave is the perfect interval between the 1st and 8th tones of the diatonic scale. See Answers.com if you want more specific information about the diatonic scale.
In western music, each octave is comprised of 12 semitones. An octave is double or half the original frequency, so (for example) one octave from middle A (440Hz) is 880Hz or 220Hz. Both 'new' notes are called A. The word octave is derived from 'Octo-' (Latin/Greek) meaning eight, because the western octave is divided into 8 'full' tones in the diatonic scale.
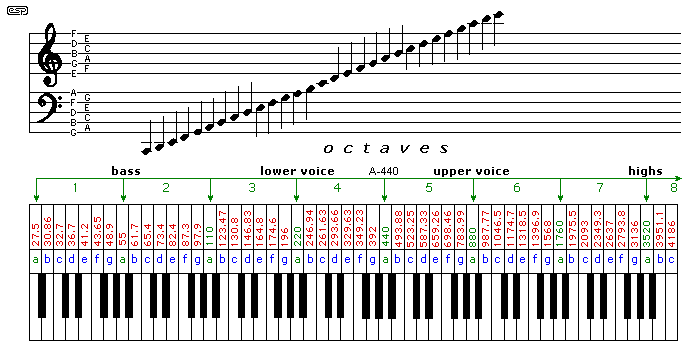
Figure 2 shows the range - the keyboard is shown as a reference only, and is not meant to be that of a real piano. Of common musical instruments, open E on a (4 string) bass guitar or double bass has a frequency of 41.2Hz, while a grand piano's bottom A is 27.5Hz. Many instruments can get far lower - examples being pipe organs and electronic synthesisers.
High frequencies are more complex. Any note is made up from the fundamental (usually taken as the lowest frequency component of the sound - the first harmonic) and a series of harmonics above this (usually at octave intervals). While many instruments produce harmonics that are exact multiples of the fundamental, others do not. A flute also contains wind noise, reed instruments often have very complex harmonic relationships, and percussion instruments can have harmonics that are not related, but extend to well beyond our hearing range (snare drums, cymbals, etc). With many plucked or struck stringed instruments the second harmonic is dominant (louder than the fundamental). This is especially noticeable with guitar, but is apparent with many other instruments too.
The division of an octave into 12 equally spaced tones is done using the 12th root of 2 (approximately 1.0594631). If you multiply 440 by the full version of this number 12 times, you get 880 - exactly one octave (depending on your calculator). The same method may be used to divide an octave into any number of divisions - for example, 3 divisions are used for 1/3 octave band graphic equalisers. The third root of 2 is approximately 1.26 in case you were wondering 
A decade (one tenth or ten times the frequency) is approximately 3.2 octaves (3.1623 or the square root of 10). Decades are sometimes used instead of octaves in engineering, although current practice most commonly uses octaves.
Frequency and amplitude are inextricably coupled in the real world, with both playing an equally important role. It is only in test and measurement where these two functions are separated, and that is so we can see how one affects the other to ensure that a reasonable standard is achieved.
The wavelength of any signal depends on the form of the signal (acoustic or electrical), the transmission velocity in the medium (air, concrete, an electrical wire) and the frequency. For audio, we are generally only concerned with the wavelength in air. While the wavelength of RF (radio frequency) signals in cables is usually very important, the wavelengths at audio frequencies in cables are very large indeed. A 20kHz signal has a theoretical wavelength of 15,000 metres (15 km) as an electrical signal, ignoring other effects such as velocity factor (look it up if you are interested). Because the wavelengths are so much greater than any normal cable length, there is no requirement for impedance matching when audio signals are carried by cables of any kind. Note that this doesn't apply to telephone systems, but this is a very different topic and is not relevant here.
Sound in air at 20°C and at sea level has a velocity of 343m/s [2]. The speed of sound varies markedly with temperature and is proportional to temperature, but the Hyperphysics calculator will work it out for you if you need to know exactly.
The formula to convert frequency to wavelength (commonly written as λ - the Greek lower case lambda) is ...
λ = c / f where c is velocity of sound and f is frequency
It is also useful to remember that sound travels at about 343mm / ms (both metres and 1 second divided by 1,000). Our hearing mechanism is carefully refined to ensure that sounds we hear are made as clear as possible, so we automatically reject repeat sounds (echoes) that arrive within about 30ms of the original. This allows us to hear clearly even in a reverberant room (or a cave a few millennia ago). 30ms means a distance of around 11.5 metres, meaning a cave room of about 5 metres square. Such a room will sound somewhat odd, but speech is still clear. Larger rooms (with longer delays) can cause a significant loss of intelligibility if one is in the 'far field' (distant from the sound source).
Being able to calculate wavelength is very important for anyone designing loudspeakers, as there are many characteristics of a speaker box design and room placement that rely heavily on knowledge of wavelength and time delay. These topics are covered in countless white papers, articles and books, and are not relevant to the material in this article.
Most beginners in electronics find dB very confusing. This is understandable, but it is easy to learn, and is every bit as important as Ohm's law when working with electronics or loudspeakers. The main thing to remember is that 1dB remains 1dB, regardless of the context. Likewise, 6dB remains 6dB. Let's look at the formulae first (no, they are not hard - calculators do almost all the work). For those who prefer not to use a calculator, there are on-line conversion tools (but it's far better if you do it yourself).
dB = 20 × log ( V1 / V2 )
dB = 10 × log ( P1 / P2 )
Where V1 and V2 are any two voltages, and P1 and P2 are any two powers (in Watts). The reverse formulae are ...
V = 10(dBu / 20) × 0.775
V = 10(dBV / 20) [ × 1 ]
P2 = P1 × 10(dB / 10)
But why are there different formulae? This is simple - power into a given impedance or resistance is determined by the square of the voltage. If 1 Volt into 1 Ohm gives 1 Watt, 2V into 1Ω gives not 2W, but 4W ( P = V² / R ). The multiplication by 10 or 20 takes this into account, so it doesn't matter if you work with power or voltage, you get the same answer in dB. The notation '10( x )' denotes 10 raised to the power of 'x' (e.g. 10² is 100).
Using dB provides a convenient way to indicate very large or small numbers, and in a way that directly relates to the way we hear. For example, it is standard practice to measure frequency response of amplifiers, speakers and many other things at the -3dB points. Speakers are commonly quoted as (for example) 40Hz - 20kHz ±3dB. 3dB means half or double the power, or a voltage ratio of 1.414:1
That last number is a good one to remember - the square root of 2 ( √2 ) is 1.414, and it is used in many electronics calculations.
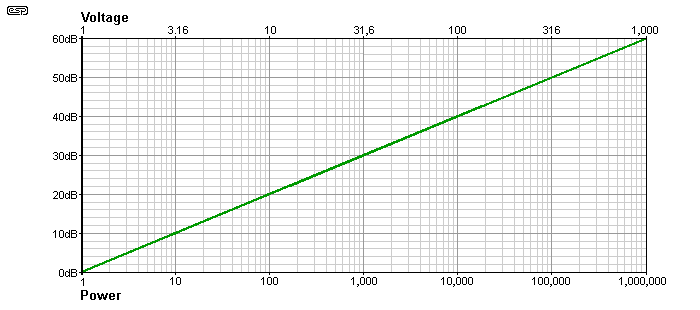
Figure 3 shows the range generally accepted as the minimum dynamic range in audio. As you can see it is vast, covering a span of 1 million to one. The total range that is of interest spans 120dB, being the dynamic range of typical good quality analogue and digital equipment. A microphone preamp may be quoted as having an equivalent input noise of -127dBm ... feel free to calculate the noise level in millivolts (it will actually be microvolts). Using dB to express such small numbers is far more intuitive than specifying the noise level as 0.346uV, which although impressively small, tells us nothing about its audibility.
Here are three very useful dB facts that are worth remembering ...
3dB = half or double the power
10dB = half or twice as loud
10dB = one tenth or ten times the power
Perceived loudness is what you hear as the change, and means that if you have a 100W amplifier and you want the sound to be 'twice as loud', you need to use a 1kW (1,000W) amplifier to do so. Note that doubling the power results in a 3dB increase, and although audible it is not dramatic. It was determined long ago that 1dB is the smallest change that the average listener can hear. While open to some dispute at regular intervals, it still holds if the test is done with a single tone under ideal conditions.
While it is sometimes believed that dB is either some absolute value or a 'dimensionless number', neither is correct. Many standards exist to refer to specific levels, both with sound and electrical devices. dBm in particular causes many problems for people, and it is often used incorrectly.
Note: dBm has actually been hijacked by radio and other technologies, so the definition has changed somewhat. It was originally used to describe only 1mW in a 600 ohm load (775mV), but is now taken to mean 1mW into any impedance (typically 50 ohms for radio and cable TV/ internet), and even optical fibre links. As it stands now, it's better to use dBm only in relation to 1 milliwatt, and use the appropriate formula to covert to a voltage based on the impedance.
There are defacto standards for 'line-level' audio, being +4dBu (1.228V RMS) for professional equipment, and -10dBV (316mV RMS) for consumer or 'pro-sumer' (professional consumer) devices. For digital systems, these are generally referred to 0dBFS - full scale for DACs and ADCs. These are 'reference' levels, but they are not regulated so vary with different equipment. Most instrument amplifiers and electronic musical instruments provide whatever signal level the designer chooses, and they are usually not calibrated against any reference level.
There is no such thing as a defined 'microphone level', because it varies over a wide range. The output of a microphone is usually specified for a particular SPL (e.g. -50dBV, referenced to 1Pa [94dB SPL]). In this case, we know that the output level is 5mV at 94dB SPL, so at 100dB SPL (6dB greater) the output will be 10mV. For example, a Shure SM58 mic has a quoted output of -54.5dBV open circuit (1.85mV at 94dB SPL, 1kHz claimed). Some mics are more sensitive than this (i.e. higher output), others less. The output voltage of many mics can reach 500mV RMS quite easily with high SPL (right next to a [loud] singer's mouth, in front of an amplifier or next to a drum skin).
While these 'reference' levels are commonly referred to, it's generally never stated whether this is the peak or average level. There's typically a 10dB difference between the two, but that varies with the type of material, e.g. speech or music ('dance', pop/ rock, orchestral, etc.). In some cases, the peak to average ratio is deliberately compressed, but getting below a 6dB peak/ average ratio is difficult, and the result is highly unsatisfactory for serious listening.
If we assume a reasonable 10dB peak/ average, that means if the average level is -10dBV (consumer) or 316mV, the peak will be 1V. For the +4dBu 'professional' level (1.23V), the peak level will be about 4V. All circuitry have to be able to accommodate the peak level without overload (clipping), so if a pro line-level input had a gain of (say) 5, the peak level will be 20V - well above the level that a typical opamp can achieve. The idea of 'headroom' is that there should always be some 'reserve' level, and 10dB is reasonable. For a 4V peak input, that means the maximum peak level could be up to 12.6V. This is usually easily achieved with opamps using ±15V supplies. Some designers will aim for a higher voltage, but that depends on the opamps. The common NE5532 has a maximum supply voltage of ±22V, and is often used with ±18V supplies to get the maximum headroom. The LM4562 has an absolute maximum supply voltage of ±18V, and the maximum recommended is ±17V. That means that you may not be able to use the latter to replace NE5532 opamps in some equipment.
When sound level readings are taken, it is common to apply what is known as A-Weighting (see Project 17 for a design and frequency response of an A-Weighting filter). The A-Weighting curve is designed to allow for the fact that out hearing is less sensitive at low and high frequencies, but fails to account for the actual SPL. When sound is above 100dB SPL, our hearing response is reasonably flat (see Figure 1), and the use of A-Weighting is inappropriate. Under these conditions, the C-weighting curve should be used, which has an essentially flat response over the audio band.
A-Weighting is also often used for measuring amplifier noise, and because this is normally only ever at very low volume, the use of the A-Weighting filter is generally appropriate. Personally I prefer not to use it, but most manufacturers do. In a truly sensible world, A-Weighting would never be used, because it's nearly always applied inappropriately. See the article Sound Level Measurements & Reality for more on this topic.
If A-Weighting is used, any mains-frequency hum is heavily attenuated (by over 30dB), and despite the claim that A-Weighting compensates for our hearing response, we can nearly always hear mains hum if it's present. Some people will refer to 'buzz' (which is far more audible) as 'hum'. They are two completely different sounds, and should be described properly so others know what to expect.
A frequency response curve is an example of the use of both frequency and amplitude, with frequency being shown on the X (horizontal) axis, and amplitude on the Y (vertical) axis. Both axes are usually logarithmic. Response curves are often provided with preamplifiers, power amplifiers, audio signal transformers, loudspeakers and microphones. Purely electrical response graphs are generally flat between 20Hz and 20kHz, but microphones, speakers and even transformers can show significant deviations from the ideal.
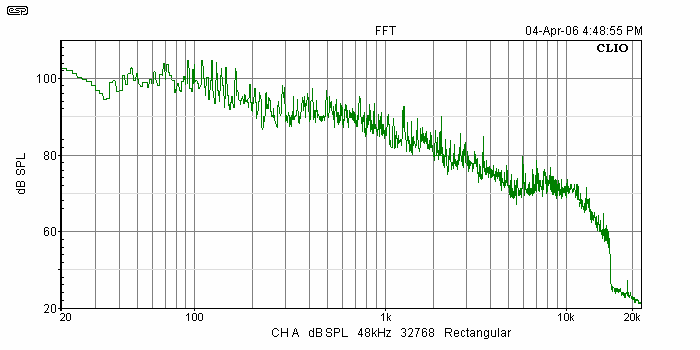
Figure 4 shows an example of a frequency response curve, in this case taken from my Clio analyser. The source material was an FM radio tuner, and the program was set up to show the highest peaks over a 15 minute period. Note that the chart includes any equalisation applied by the radio station (I used radio Triple J as the source - they do not play advertisements, thus eliminating pollution caused by the often radical EQ and compression that is used in ads to make them sound 'loud'. The 19kHz FM stereo pilot tone is just visible on the right side of the graph, and you can see that the FM bandwidth is limited to 15kHz. (The pilot tone is used to identify a stereo transmission, and is used by the stereo decoder to derive separate left and right channels from the 38kHz sub-carrier.)
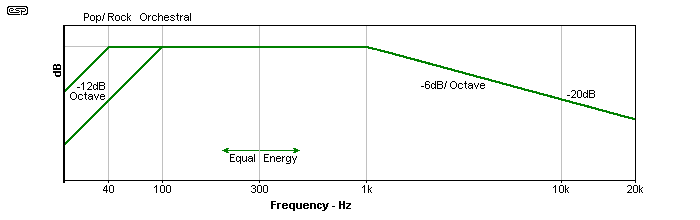
It is generally accepted that the overall energy distribution of music looks more-or-less like that shown in Figure 5. That there will be variations is obvious, and while interesting and potentially useful, you cannot rely on any simple graph to determine how much power you need. Loudspeaker efficiency and peak to average ratio of the signal must also be considered.
Peak to average ratio is an important topic itself. Because music has dynamics (loud and soft passages), and because of the nature of a complex audio waveform, the RMS (root mean squared) voltage is useful only to get an idea of the average power delivered to a speaker. The RMS value of a sinewave is 0.707 of the peak voltage, as shown below.
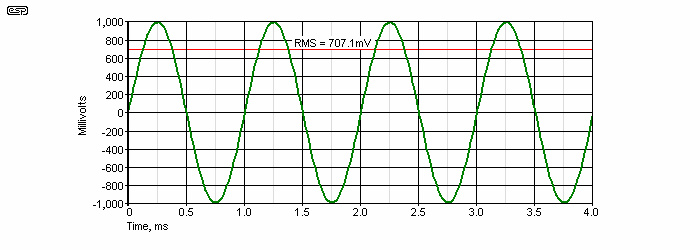
You may recall that I said earlier that one should remember the number √2 (1.414). The RMS value of a sinewave is determined by dividing the peak value by 1.414, or you may multiply by 0.707 (the reciprocal of 1.414 ... i.e. 1 / 1.414 ). In Figure 6, the peak value of the sinewave is 1V, and the RMS value is 707.1mV. Most meters display the RMS voltage, but only those called 'True RMS' will get the value right for a complex waveform such as that shown in Figure 7. Not that the waveform is especially complex - it is made up from 3 sinewaves, at 1kHz, 2kHz and 4kHz, all with a peak voltage of 1V.
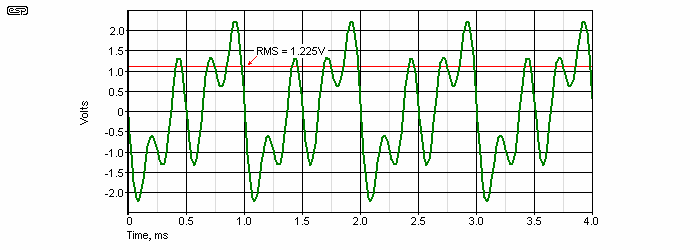
The real RMS voltage of the waveform in Figure 7 is 1.225V. If one uses the calculated RMS voltage (based on the peak voltage of 2.33V), the answer is 1.566V - an error of almost +22% (+2.13dB). Most meters are average reading, RMS calibrated, meaning that the signal is rectified and averaged, but the meter scale is calibrated to read RMS. Such a meter will give a reading of 1.014V, a -12% error (-1.65dB). It is very easy to introduce serious errors into any calculation that involves complex waveforms, and this is one of many reasons that a reasonably pure sinewave is specified for most test procedures. While 'True RMS' multimeters are more accurate, some do not handle high crest factors well. The crest factor is the ratio of the peak and RMS values of a waveform, and to work well with high crest factors, some serious maths is generally needed. Digital oscilloscopes with voltage readouts compute the value, and will usually get it right (but with limited 'absolute' accuracy).
True RMS meters may also have limited frequency response, especially at low levels. Readings can also be very slow at low levels, because the IC used to 'compute' the true RMS value can't handle low levels as well as high levels. Most work best at close to their maximum input voltage (often around 200mV).
Because crossover networks are an unavoidable requirement in quality loudspeaker systems, they also require some explanation. Crossovers are used to separate the audio band into a number of separate frequency bands. The frequencies are chosen to suit the loudspeaker drivers being used, and (to some extent) the requirements of the designer.
| Driver Type | Minimum Frequency | Maximum Frequency |
| Subwoofer | < 20Hz | 100Hz |
| Woofer | 40Hz | 300-3kHz |
| Mid Woofer | 100Hz | 3kHz |
| Midrange | 300Hz | 3kHz |
| Tweeter | 1.5kHz | > 20kHz |
| Super Tweeter | 10kHz | 30kHz |
The above table is not intended to be absolute. There are a great many factors that influence the way a driver can (or should) be used, and these are not relevant to this article. The crossover network is also subject to many variations. Apart from the choice of frequency, there is also the choice of slope (the rate of attenuation with frequency), some networks are deliberately designed to be asymmetrical, having different slopes for the high-pass and low-pass sections.
Filters are divided into four different types ...
No filter simply stops all signals above or below the specified frequency. As the selected frequency is approached, the signal level starts to reduce, and the filter frequency is usually taken as that frequency where the signal level is 3dB below the passband. There are exceptions, and these will usually be explained in the description of the network.
In order to obtain different rolloff slopes, filter 'building blocks' can be connected in series to obtain a greater rate of attenuation. The commonly used filter orders are as shown below. The simplest filter is a first order, and uses one reactive component (a capacitor or an inductor). A second order filter uses two reactive elements, and so on.
| Filter Order | Rolloff Slope | Reactive Elements |
| First | 6dB / octave | 1 |
| Second | 12dB / octave | 2 |
| Third | 18dB / octave | 3 |
| Fourth | 24dB / octave | 4 |
Active filters require power - they are called 'active' because they use active components, such as opamps, transistors or sometimes valves. Passive filters use only passive components - capacitors, inductors and resistors. Passive filters always have losses (especially resistance in inductors), so not all the amp power gets to the speakers. At high power levels the losses can become very high, reducing the available power for the speakers and causing inductors to run at high temperatures.
Active filters require a separate power amplifier for each loudspeaker driver, while passive networks use a single amp. There is a tradeoff - do we use large and expensive passive components and a single (relatively) large power amplifier, or an active crossover and a number of smaller power amps?
It depends on what we are trying to achieve, the expected performance and the budget. It would be silly to use an active crossover and separate amps for a cheap PC speaker, and equally silly to use passive crossovers in a large sound reinforcement system running at perhaps 5,000W or more. All filters (whether active or passive) will provide a rolloff slope based on the filter order. With passive crossovers, it is usually necessary to compromise because high-order filters become too expensive and consume excessive power. There is much more detail in the article Biamping - Not Quite Magic, But Close.
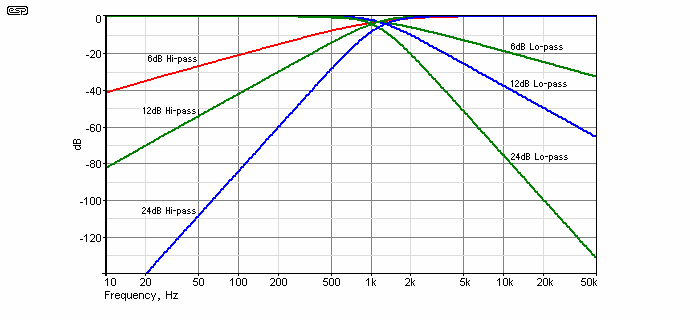
These filters are all set for 1.1kHz so they can be compared. This is not usually considered a useful frequency for loudspeakers, but is convenient for purposes of illustration. Here you can see the rate of rolloff for the 3 types shown. Higher order filters provide greater protection for the speaker (especially tweeters), but cause greater phase shifts than low order filters. While not usually audible, some designers will try to avoid phase shift as far as possible.
All analogue filters cause phase shift - it is a characteristic of how they function in the analogue world. FIR (finite impulse response) digital filters can be configured so there is no phase shift, but despite claims to the contrary, we usually cannot hear a static phase shift. If the phase is constantly changing, we will often hear a frequency shift due to phase shift modulation (Doppler frequency shift is an example).
All of the examples in this section show a combination of frequency and amplitude. It must be stressed that a full and complete understanding of these topics is essential to your understanding of audio as a whole. Without that understanding, you are left wondering what certain terms really mean. You may also become less likely to believe some of the outrageous drivel that is spouted by some manufacturers - they rely on a lack of understanding to baffle people with pseudo-science.
This short article is intended to introduce the basics of each of the topics shown. Far more information is available, either on the ESP site or elsewhere. Some of the explanations have been simplified for clarity, but care has been taken to ensure that the simplifications are not at the expense of accuracy.
Some of the images in this page came from Lenard Audio (with permission). They have been modified and adapted to the style normally found in the ESP site for general compatibility.
| Main Index
Articles Index
|