
|
|
| Elliott Sound Products | Squarewave Testing Of Amplifiers & Filters |
 Main Index
Articles Index
Main Index
Articles Index
Squarewave testing is a way to test many things at once, but you have to know what to look for. This article explains the many different waveforms you can get from an amplifier or filter, and shows what each waveform actually means. A squarewave is a signal that's rich in harmonics, and because it's symmetrical the harmonics are all odd - 1st (the fundamental), 3rd, 5th, etc. A 'perfect' squarewave has harmonics that extend to infinity, but somewhat predictably perfection isn't attainable. However, most common squarewave generators can easily produce harmonics that exceed the response capability of any audio amplifier.
By using squarewaves to test equipment it's possible to see a wide range of potential problems, but you need to be able to determine what really is a problem and what is normal behaviour. By necessity, this article has a great many diagrams. most of these will not show the original squarewave, because it's ... well, a squarewave. By themselves, they are decidedly uninteresting, but after processing through a filter or an amplifier we can see the essential characteristics of the device under test (DUT).
If you've not done any squarewave testing, I encourage you to hook up a few circuits (they are shown in the appendix) so you can experiment. This is an excellent way to learn just how a squarewave can be modified by filters, including tone control circuits which are very enlightening.
The examples shown here are quite deliberately fairly subtle. In many cases you will see squarewave response that's far greater than shown in any of the diagrams. That doesn't indicate a fault, it simply means that the circuit has more of whatever is modifying the waveform or phase than these examples show. For example, it's easy to get far more treble cut or boost than you'll see in any of the following examples, so you have to learn how to interpret the results.
Although it's not covered here, it's worth noting that a triangle wave has the same harmonics as a squarewave (i.e. odd only), but they decrease at a different rate and have a different phase relationship from the fundamental. It is important to understand that any waveform that exists can be synthesised using sinewaves with the appropriate amplitude, sequence and phase. Likewise, clipping a sinewave generates exactly the same harmonic sequence as crossover distortion, with the only difference being the phase angle of the harmonics. You can see the harmonic progression easily using FFT, but that doesn't include phase information - only amplitude.
Before we start looking at modifications to the waveform, it's useful to see the squarewave and its harmonics. This was deliberately simulated, using a squarewave with lightning-fast rise and fall times (1ns). You won't get real squarewaves this fast from any commonly available waveform generator. A rise and fall time of 1ns indicates a bandwidth well in excess of 1GHz, and this is not necessary or desirable for amplifier testing.
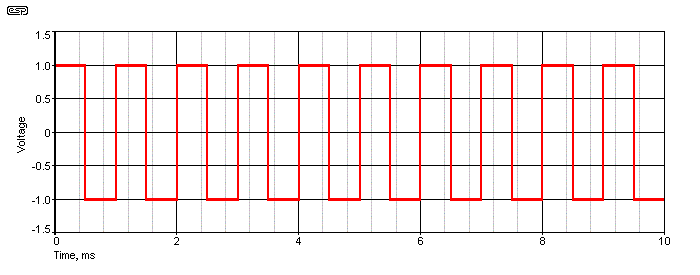
Figure 1A - 1kHz Squarewave
There's not too much that's remarkable about a squarewave. By definition, the mark-space ratio is 1:1, meaning that positive half cycles and negative half cycles are exactly equal in amplitude and duration. The RMS value of a squarewave is simply its peak value, so for the waveform shown it's exactly 1V RMS.
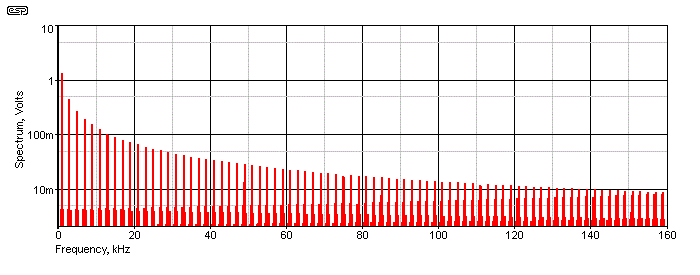
Figure 1B - 1kHz Squarewave Spectrum
The spectrum shows that there is a continuous band of frequencies that are exact odd harmonics of the fundamental. I've only showed harmonics up to 160kHz - not because the simulator can't show more, but because there's no point. The amplitude (A'n') of each harmonic can be calculated easily, using the formula ...
A'n' = ( 2 / ( π × n )) × V Where 'V' is the peak-peak voltage of the squarewave and 'n' is the harmonic number (odd only).
So if the squarewave is 2V peak-peak as shown, the 1st harmonic (the fundamental) is at 1.273V, the 3rd harmonic will measure 424.4mV, the 5th is at 254.6mV, etc. You don't need to know this, but it is useful background for you to use if you ever happen to need it. For the most part you'll probably never use this info, so I wouldn't worry about trying to remember the formula. If you look carefully at the spectrum, you'll see that the voltages are as calculated. It's important to understand that a 'true' squarewave is perfectly symmetrical and has no even order harmonics (2nd, 4th, etc.). If your squarewave has any evidence of even order distortion, that means it's not symmetrical - the positive and negative portions of the waveform are unequal.
Now it's time to look at something that's very interesting. Figure 1C shows a waveform made up from sinewaves, using the amplitude sequence shown above. The waveform has a fundamental frequency of 1kHz, and has sinewave oscillators at 2kHz intervals (3kHz, 5kHz, 7kHz, 9kHz, 11kHz and 13kHz. You can see the 'squarewave' starting to take shape, but there's something very strange that you need to be aware of. It's not immediately apparent, but the 'ripple' at the top and bottom of the waveform measures ... 14kHz! The number of peaks you see is the same as the number of sinewave generators, so with seven generators (the fundamental and six harmonics), there are seven peaks. Eight oscillators means eight peaks, etc.
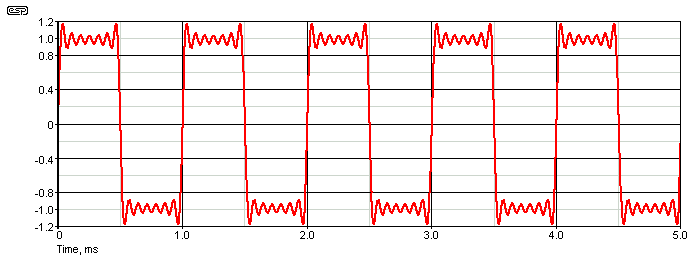
Figure 1C - 1kHz 'Squarewave' Made from Sinewaves
There's a mathematical formula that explains exactly how a seemingly completely unrelated 'frequency' is developed in this way, but I don't intend to show it here as it's deeply rooted in 'pure mathematics'. I have a feeling that most readers will also be somewhat ambivalent, but if you really want to know more there's plenty of info online. The point to take from this is that it's real (or at least a 'real artifact'), and it will show up in a simulation or an oscilloscope. With traditional test gear it will be almost impossible to duplicate, but a simulator is blessed with 'ideal' sine generators, which never drift in frequency and have zero distortion. You may (or may not) have seen CD player squarewave response that looks almost identical to that shown in Figure 1C, but with more 'ripples'. This is due to a higher cutoff frequency and is characteristic of FIR (finite impulse response) digital filters. An analogue or digital IIR (infinite impulse response) filter will show ringing only at the leading edge (rising or falling), with no ringing visible at the trailing edge.
The effect seen is known as the Gibb's phenomenon, and it is not 'real'. The apparent frequency doesn't exist, even though it can be seen in a simulator or on an oscilloscope. Feel free to look it up for yourself. If you combine as many sinewave oscillators as you can bear to configure, the ripples never go away. This one of those things that you just have to accept - a 'proper' squarewave is (of course) perfectly flat-topped, and has no ripples.
The interval between any two peaks, dips or 'zero crossings' is 71.42µs, give or take 0.5µs or so (even a simulator has accuracy limits). As more and more harmonics are added (with the exact amplitudes described above), the waveform starts to look more and more like a 'proper' squarewave. If a true squarewave is filtered with a sufficiently sharp low-pass filter, you'll see a similar waveform start to emerge. Don't expect to see it with a practical analogue filter, but a digital FIR (finite impulse response) filter can produce something pretty close. If we add another sinewave generator (at 15kHz) the ripple frequency increases to 16.19kHz (and 8 peaks). An alternate measurement just takes the ½ cycle period (500µs) divided by the number of peaks. So ...
500µs / 7 = 71.428µs
f = 1 / period = 1 / 71.428µs = 14kHz
This is actually probably closer to reality than using the simulator to measure the 'ripple' frequency. Quite obviously, this frequency is not a harmonic, as it's even, and we used only odd harmonics to 'build' the squarewave. It's a mathematical artifact, and it does not appear as a frequency in a fast Fourier transform (FFT). Eventually, and with enough sinewave generators, the waveform will start to look like a 'proper' squarewave. However, that means you need a great many sine generators which becomes tedious pretty quickly. With an infinite number of sinewaves, the peak at the rising and falling edges will still be at the same amplitude as shown above, but it will be infinitely narrow (so it ceases to exist). Note that a squarewave generated by any simple analogue (or digital) circuit shows no sign of the peaks and ripples, because they aren't real. The appearance of something that looks real but doesn't exist may be a little confronting.
Note that while the above is interesting (well, I thought so anyway), it's of little or no practical use. It has nothing to do with squarewave testing as such, but knowing that a squarewave is made up from a (theoretically) infinite number of sinewaves will help you to understand why squarewave testing is so revealing. Note that no analogue filter can recreate the Gibb's phenomenon, nor can IIR (infinite impulse response) digital filters, which are the digital equivalents of analogue circuits. Increasing the slope doesn't help (I've tried it with a 12th order filter, 72dB/ octave rolloff!).
The leading edge of a 'proper' squarewave has a very high slew rate. In the case of the test waveform here, the voltage changes from -1V to +1V in 1ns, so the slew rate is 2,000V/µs. Volts/microsecond is the most common way to specify slew rate, and you'll see the figure quoted for many opamps in the datasheet. It's simply a measure of how many volts the output can swing in one microsecond. Typical opamps range from around 0.5V/µs (µA741) and 20V/µs (LM4562) with the majority of audio opamps being around 8-12V/µs.
As the allowable output voltage swing increases, so too does the slew rate for a given frequency. For sinewave tests, the slew rate of the sinewave is determined by the following ...
SR = 2π × f × Vpeak If f is in Hz, answer is volts/second
So, for an amplifier that can provide a peak output of ±35V, the slew rate for a sinewave at 20kHz is ...
SR = 2π × 20k × 35
SR = 4.39 MV/s
SR = 4.39 V/µs
When the input waveform is significantly faster than the amplifier stage, the leading and trailing edges will no longer be vertical, because the amplifying circuit has a limited bandwidth. It is very easy to perform a squarewave test and end up with an entirely wrong answer if you're not careful. Much of the brouhaha that developed regarding TIM (transient intermodulation distortion) and/or SID (slew induced distortion) were due to the very fast risetime of the test signal. When testing any audio device, you must be aware of the simple fact that music does not contain very fast risetime signals, and most media (vinyl, CD, etc.) are actually not very demanding. This is because the amplitude of the musical harmonics is reduced by at least 6dB/octave from no higher than 2kHz or so. This means that the actual level at 20kHz will typically be 20dB lower than the level at midrange frequencies.
Therefore, an amplifier that can provide ±35V peaks will only be required to provide around ±3.5V peaks at 20kHz when operating just below full power with music as the input. This dramatically changes the required slew rate, but it's very common (and advisable) to ensure that an amplifier can reproduce no less than 50% output voltage at 20kHz to ensure an acceptable safety margin. TIM may have been discredited (along with its siblings), but it doesn't make any sense to limit an amplifier if it's not necessary. It also doesn't make sense to go to a great deal of additional effort to design an amplifier that can reproduce full power at 100kHz (or even 20kHz), because it will never be needed.
Most competent amplifiers can handle a band-limited squarewave with no fuss. Before using the squarewave, it should be passed through a filter that rolls off the response above 20kHz. Failure to use bandwidth limiting won't hurt the amplifier, but you may see artifacts that will not appear in normal use. A low-pass filter using a 1k resistor and 10nF capacitor gives a response that's considerably faster than the harmonic structure of music, but doesn't stress any amplifier too hard. The filter has a nominal -3dB frequency of 15.9kHz. My function generator has a risetime of 12ns for a 1V RMS squarewave - much too fast for even the most esoteric amplifier, so a filter is needed to prevent the DUT from slew rate limiting.
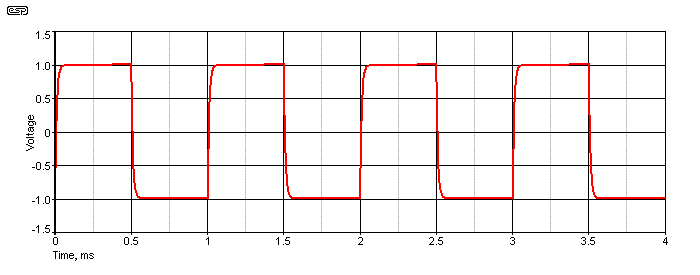
Figure 2 - Band Limited 1kHz Squarewave
The waveform shows the same squarewave seen in Figure 1A, but with a 1k + 10nF capacitor arranged as a low pass filter. So the waveform is easier to see, only four complete cycles are shown. This will be the case for all subsequent waveforms, and where possible the same vertical scale will be used as well. From this waveform, you can see the result of a low pass filter - the risetime is increased. As the input frequency approaches the filter's frequency, the effect becomes more obvious. Equally obvious is any circuit that applies high frequency boost, but we'll look at that in the next section.
It's also worth examining the risetime - it's usually measured between 10% and 90% of the waveform's peak-to-peak amplitude. The reason for this is simple, in that many circuits will have some small 'disturbance' as the voltage starts to change and just before it reaches the opposite peak voltage. By excluding the fist and last 10% of the waveform these disturbances are minimised and the true risetime (and from that the slew rate) can be determined more accurately.
If you know the risetime you can determine the approximate frequency that represents. For example, the low pass filtered waveform shown above has a risetime of 22us, so we can apply the formula [ 1 ] ...
f = 0.35 / t10-90
f = 0.35 / 22µs
f = 15.9kHz
The slew rate for this filtered signal at 1V RMS output is 0.082V/us, but of course if that's amplified through the DUT then the slew rate at the output will be much higher. Feel free to use a higher order filter tuned to a higher frequency if it makes you feel any better. For example, you might prefer to use a 24dB/octave filter tuned to (say) 22kHz. This will decrease the risetime only slightly (about 19us), but the sharp cutoff slope will cause slight overshoot of the leading edge.
Figure 2 shows gentle bandwidth limiting, but if there is significant high frequency attenuation the squarewave starts to lose most of its 'character'. This is illustrated below, and the filter now uses a 1k resistor and a 100nF cap. The -3dB frequency is 1.59kHz, and a 1kHz squarewave is severely rounded off.
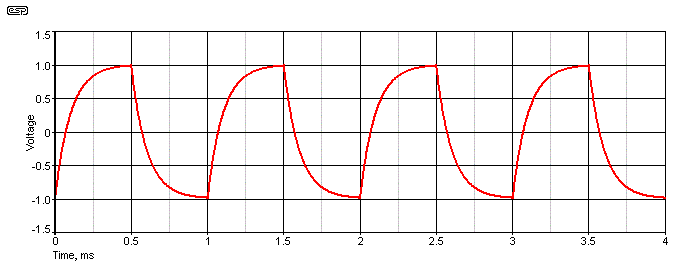
Figure 3 - 1.59kHz Filter
Simply by looking at the wave shape with a squarewave input, it is quite easy to see high frequency attenuation. Although the amplitude of the fundamental is not greatly affected, all the harmonics are reduced by the filter, producing the very rounded waveform shown. A squarewave also lets us see if there is high frequency boost, as we see in the next graph. This is commonly referred to as 'overshoot', because the leading edge of the waveform extends beyond the steady state value. Overshoot can also be caused by filters with high rates of attenuation (typically 12dB/octave or more), and doesn't always indicate treble boost. You need to be able to interpret the results before jumping to confusions. 
If you are testing tone controls, you fully expect to be able to get treble boost and cut, and the response should smoothly transition between them as the pot is rotated. If you also listen to the result, you'll hear the change easily.
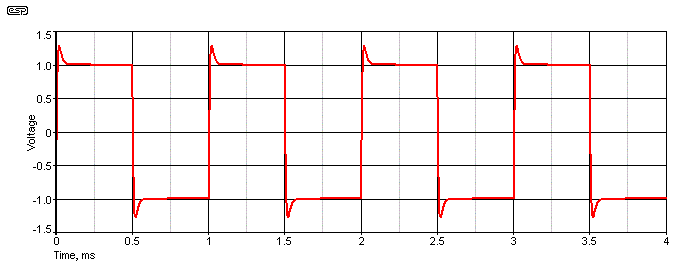
Figure 4 - HF Boost
The input for this was the same waveform shown in Figure 2, with a band limiting filter of 1k and 10nF at the input. The signal is then processed through a simple opamp circuit that applies 6dB of boost at the same frequency. You might expect the two to cancel out (which can also be done), but because the cut and boost circuits are not perfectly symmetrical we see a small amount of treble boost. The waveform shown indicates that there's 1.34dB of boost at 12kHz. So, just by looking at the squarewave response, you can see if there's high frequency rolloff, boost, or as we see next, ringing. This effect is commonly seen at the output of Class-D amplifiers where the terminating impedance is not a perfect match for the filter components.
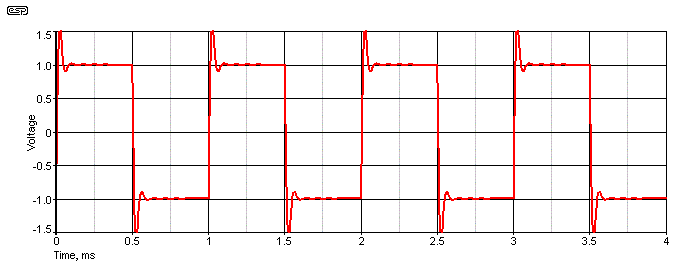
Figure 5 - HF Ringing
If you only do a frequency response measurement it's very easy to miss ringing. It always shows up in the response, but it can be missed as being just a bit of high frequency boost. By testing with a squarewave you can instantly see things that are otherwise easily missed. Remember that these waveforms all use the band limited squarewave shown in Figure 2, and a faster risetime will make the effects more apparent. This depends on the circuit of course - if it has its own bandwidth limitations what you see will be a combination of everything that affects the response.
High frequency ringing indicates that there is a resonant circuit within the DUT. The duration of the ringing gives you an idea of the resonant circuit's Q, and high-Q resonance will cause the oscillation to continue for several (or many) cycles. Some very steep filters can also cause damped ringing as well, especially Chebychev types which have a peak before they roll off. Valve (vacuum tube) output transformers are another source of ringing, caused by the natural resonant frequency of the transformer. Provided the ringing frequency is well above the audio band it usually doesn't cause any problems, but it should always be checked to ensure that the effects aren't audible.
Ringing is something of an anomaly. When checked with a squarewave, it will appear that the ringing waveform is at a fixed frequency that's not directly related to the fundamental. You can vary the input frequency, but the ringing looks like it's at a frequency that's solely dependent on the resonant frequency (based on capacitance and inductance, and damped by resistance). However, if the ringing frequency is truly unrelated to the input, then that implies that a new frequency has been created - something that generally requires a non-linear circuit element. A simple passive (or linear active) circuit can't 'magically' create a new frequency.
Remember that the squarewave has harmonics that extend to many, many kHz, and if the input squarewave is at 1kHz, the harmonic frequencies are just 2kHz apart. If we have ringing at (say) 12kHz, that's seemingly not related to the input frequency, but it's an almost impossible task to measure it accurately with any standard test equipment. The ringing is a damped oscillation, triggered by the closest harmonic(s) of the input signal. Close examination with a simulator shows that the ringing frequency is not fixed, but varies very slightly as the input frequency is altered.
To make sense of this, you can't use the time domain (as shown by an oscilloscope). If you use a FFT (fast Fourier transform), you'll see a peak or a notch around the resonant frequency, depending on the filter characteristics. The waveform (as seen in the time domain) is best described as an artifact - it's (kind of) real, but it only tells you part of the story. A simulator has the accuracy and resolution to be able to see what's really happening, an oscilloscope does not! Remember the artifact shown (Figure 1C) when you start building a squarewave from sinewaves - to some extent, the ringing waveform is in a similar category.
Squarewaves also show you what happens with low frequencies. The slope of the (normally) flat peaks show the effects of bass boost and cut, and the amount of slope is an instant indicator that bass frequencies are either attenuated or boosted. It's important to verify that the slope on both the positive and negative parts of the waveform are perfectly complementary. If not, this usually indicates that something is wrong. You are more likely to see asymmetrical waveforms with valve amps than anything using transistors or opamps.
If the top and bottom (the 'flat') parts of the squarewave are tilted, it means there is phase shift. However, in almost all cases, phase shift comes free with response variations, and all cases of reduced or boosted bass response are accompanied by phase shift, so the tilt can be seen as an indicator of bass boost or cut. Phase shift without response changes is certainly possible, but is extremely uncommon. If the waveform shows a rising slope (as seen in Figure 8) that always means there is some bass boost. It's theoretically possible for phase shift alone to cause this, but I've never seen it in a working circuit.

Figure 6 - Moderate Low Frequency Attenuation
The above shows moderate bass cut, and in this case, the -3dB frequency is 159Hz. The input squarewave is again 1kHz as with the other examples. As you can see, the flat portion of the waveform is sloping down from the leading edges. If the bass cut is made much more severe, the slope is exaggerated as shown when a bass cut filter has a frequency that's higher then the squarewave frequency. Figure 7 has a bass cut frequency of 1.59kHz. The waveform is what you expect from a differentiator, because that's what it is.

Figure 7 - Severe Low Frequency Attenuation
Conversely, if the bass is boosted the flat section of the squarewave will rise, as shown below. The bass boost +3dB frequency is (nominally) 159Hz, but the bass is boosted so that the maximum boost is 6dB at a low frequency (around 20Hz or less). More bass boost causes the angle of slope to increase, and it doesn't take long for anyone with a squarewave generator, oscilloscope and a set of bass and treble controls to see the interactions that are possible.

Figure 8 - Low Frequency Boost
In every case where the frequency response is changed, so too are the harmonic amplitudes. However, it's not the subtle variations of harmonic voltages that cause the waveform to change, but rather their relative phase that influences the shape of the waveform. This is particularly true of bass boost and cut. Certainly the harmonics change, but it's possible to change the wave shape below the fundamental frequency, which seems as though it should not be possible.
This is one of the great benefits of squarewave tests - you can see variations both above and below the fundamental frequency, something that isn't possible with sinewave testing. If you test with a sinewave and want to see the effect at (say) 20Hz, you have to use a 20Hz sinewave. With a squarewave, you can see the effect of boost or cut at frequencies well below the test frequency. A squarewave is unique in that regard, and that's why they are such a useful test tool.
This is where things get really interesting, and in more ways than one. In the trace below, the signal has passed through an 'all pass filter'. This is not a filter in the normal sense, since its frequency response is flat. However, in this case the filter was tuned to provide 90° of phase shift at 1.59kHz (10k and 10nF again).
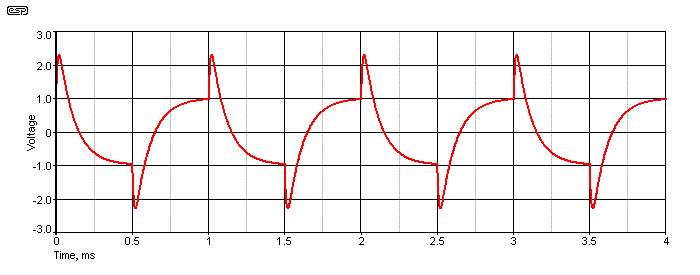
Figure 9 - Effects Of Phase Shift Network
The shape of the waveform is changed radically, and it no longer looks anything like a squarewave. However, the harmonic amplitudes are unchanged, and only their relative phase has been altered. You would expect this waveform to sound completely different from the original squarewave, but it doesn't. In fact, it sounds just like the original in all respects, and you can even vary the amount of phase shift while listening, and hear no change at all - provided it's done slowly. Fast changes are audible, but mainly because the effective frequency is changed. This is difficult to understand based simply on a written explanation, and I'm not about to write pages of mathematical proof. It's a lot easier and far more instructive to build the circuit and listen for yourself.
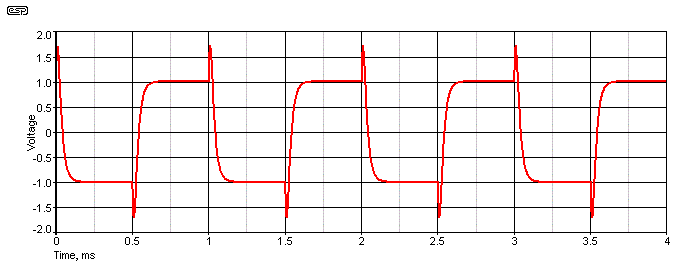
Figure 10 - Phase Shift Network (7.2kHz)
It's quite easy to get seemingly impossible waveforms, such as that shown above. If the phase shift network's frequency is increased, the trailing edge of the squarewave is affected as shown. A frequency scan will not show any anomalies with anything that affects phase but leaves the frequency response unchanged. Probably one of the most extreme is a crossover network, which ideally leaves the frequency response unchanged when the high and low pass outputs are summed, but the modified phase response is seen clearly and instantly.
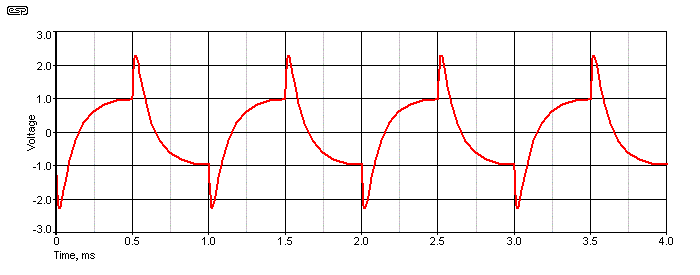
Figure 11 - Summed Outputs Of 12dB Crossover Network
The response shown is from a 12dB/octave Linkwitz-Riley crossover network, with a crossover frequency of 1.59kHz. If you look closely and compare it with Figure 9, you'll see that the difference is vanishingly small - that's because the crossover network introduces the same phase shift as the phase shift network. Different crossover slopes cause the waveform to change, but the frequency response should remain exactly the same ... flat.

Figure 12 - Summed Outputs Of 24dB Crossover Network
The phase response of a 24dB/ octave crossover filter looks positively gross, but if you listen very carefully (preferably with music, but you can try a squarewave as well) to the summed signal shown above and the original, you may hear just the slightest difference ... or not. The test must be double blind. If you know what you are listening to, you will hear a difference whether there is a change or not. This is because our hearing is not very sensitive to phase shifts within a signal, provided the associated time delay (known as group delay)is below the threshold of audibility ... which for a 24dB filter it is. Some of these tests can be confronting, so an open mind (and a blind test regime) is essential.
 | If you are listening to a squarewave (they don't sound pleasant, but the test is revealing), you'll usually find that even small movements of your head in relation to the source will cause a change in tonality. This is caused by standing waves and early reflections, and the audible effect will be dramatically greater than any phase shift caused by an all pass filter or summed crossover outputs. You need to be aware of this because otherwise you may mistakenly attribute the change you hear to phase shift - it's not. |
If you think you do hear a change, you then need to ask yourself this important question ... "If I were to leave the room and someone changed the switch from the summed filter to direct (or vice versa), would I hear the difference when I came back?". If unsure, enlist the help of someone and do that very test ... you'll find that the answer is "No".
Because there are so many possibilities, I assembled the drawing shown below. This is a 'composite' of the various effects described, plus a representative indication of band pass and band stop filters (both low Q). These simulations both used filters providing 6dB boost or cut at the resonant frequency, and the squarewave input is at the same frequency as resonance. You will see different effects again as the test frequency is changed relative to the filter frequency. The range of waveforms you can see on the oscilloscope is vast, and it's simply impossible to try to show every case. Fortunately it's not necessary because the general trends will be obvious when you start to experiment for yourself. The more different test circuits you have available the better.
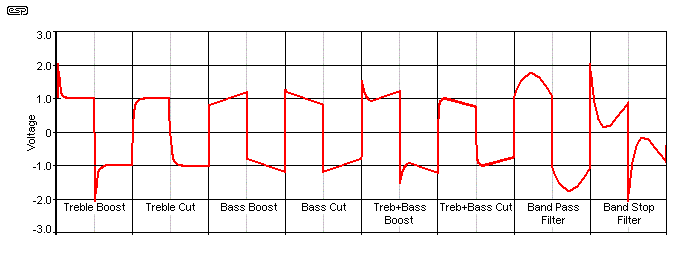
Figure 13 - Composite Drawing Showing Common Effects
One problem that many hobbyists will face is the lack of a suitable squarewave generator. This is quite easily solved as well, using a circuit like that shown below. You need only to supply a sinewave at the required frequency and the CMOS IC will convert it to a very good squarewave with extremely fast risetime. The 4584 (or 74C14) is a CMOS hex inverter with Schmitt triggers on all gates. Output rise and fall times are quoted as 40ns (typical) and 80ns (maximum) when running at 15V. The input stage on the left will convert a sinewave into a squarewave, and the one on the right generates a squarewave directly. The approximate frequency is given by ...
f = 1 / ( 1.7 × R × C ) Where f is frequency, R is resistance in ohms and C is capacitance in Farads
With the values shown, the circuit will oscillate at any frequency from about 114Hz up to 1.25kHz. Wider range can be obtained by switching the capacitor value (for example you could use 4.7nF to get to 12.5kHz and 470nF to get down to 12Hz). This alternative input stage means that you don't need a sinewave oscillator, as you can generate squarewaves directly. Excellent supply bypassing is essential, otherwise the waveform will be corrupted by supply variations created when the CMOS inverters switch. The 100nF cap (C5) should be multilayer ceramic, and placed as close to the IC's supply pins as possible.
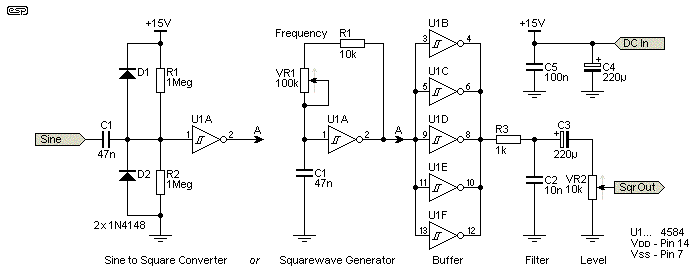
Figure 14 - CMOS Inverter Squarewave Generator
The remaining five inverters are wired in parallel to provide the maximum possible output current and allows a fairly low output impedance. Note that the output current from CMOS devices is limited, so the circuit can't drive a low impedance load without the level being reduced dramatically. VR2 lets you set the output level. The whole circuit is powered from a single 15V supply, but lower voltages can be used if more convenient.
The minimum suggested supply voltage is +5V, or a 9V battery is a convenient way to power the circuit. Naturally, as the supply voltage is reduced so is the output level. C2 is a large value to ensure there is minimum low frequency rolloff. With the output feeding a high impedance, the -3dB frequency is 0.07Hz. After power is applied, it will take over 30 seconds before the squarewave is properly centred around zero volts.
C2 and R3 form the filter described above. The -3dB frequency is 14kHz and the output is about 4.5dB down at 20kHz. This is still a fairly severe test, but it's better than using a signal that is dramatically faster than any audio signal. Needless to say, C2 can be omitted (or switched) so a very fast risetime is available if needed. Be careful with the output lead, because the output impedance is just over 2.5kΩ with the pot at halfway, so test leads with significant capacitance will cause additional rolloff for high frequencies.
Squarewave testing lets you see things that can be quite tedious to measure using 'traditional' sinewave tests. In particular, the frequency response can be seen at a glance - a squarewave with a frequency of between 400Hz and 1kHz will show any high frequency rolloff, ringing and low frequency rolloff. The measurement doesn't give you actual numbers, but it is very quick and instantly alerts you if anything is out of the ordinary. Should you test both channels of a stereo amp and one is quite different from the other, you know immediately that something is wrong and requires further investigation.
Using a squarewave is useless for checking crossover distortion or an amplifier's overload recovery time. These tests must be performed with sinewaves. Likewise, you can't test distortion with a squarewave, because the waveform itself has a (theoretical) total harmonic distortion (THD) of over 48%. In reality it will be a bit less, because of finite risetime. The filtered squarewave used for the tests described here has a THD of 43.5% according to the simulator. Squarewave testing is an additional tool, but it doesn't replace any of the more common tests that you might use.
Squarewave testing shows many things of interest very quickly. It's also useful to test equalisers of all kinds, because you can inject a frequency of around 100Hz, and be able to hear (and/or see on an oscilloscope) the bass, treble and/or midrange controls in action. It's especially useful with graphic equalisers because you may have a great many sliders, and you can test each in turn and listen to the result. The harmonic amplitudes are affected by the equaliser, and you can both see and hear this easily.
There is plenty of info on the Net about squarewave testing, but sadly some people have no idea how to interpret the results. Much of the available material only scratches the surface, and some of it is just wrong. Even this article is not as detailed as I would have liked. Unfortunately, there is just too much to even try to explain everything, but it's hoped that the info provided is enough to get the reader interested, and explains the results in enough detail so the results make sense. Ultimately, interpreting the results takes experience so I encourage readers to experiment with as many different circuits as they can so that interpretation becomes easy. It is easy, and it won't take long before you'll be an expert.
Main Index
Articles Index