
|
|
| Elliott Sound Products | Simple Network Lowers f3 |
 Main Index
Articles Index
Main Index
Articles Index
This is a contributed article. The general technique of increasing Qtc is described in the ESP articles section (see Impedance for more information). While the ESP article covers the topic from general principles, Peter has explained the maths involved and has gone into far more detail than I did at the time.
My personal preference would be to use a passive line level equaliser, one of which I have installed on my bedroom system to increase the bass output of the small transmission line speakers I use there. Peter's method has a couple of advantages - the 'damping factor' at higher frequencies is improved because of the parallel capacitance, and the speakers are self contained, requiring no external equalisation box. The disadvantage is that efficiency is reduced significantly, but as Peter points out, this is not necessarily a problem. In addition, the equalisation described provides a benign load to the amplifier, with much reduced phase shift compared to that experienced when directly driving the loudspeaker.
While it is suggested below that the equalisation network should be mounted externally, if the rear of the box is made from 3mm aluminium plate that will act as an excellent heatsink for the power resistors. The resistors should be firmly mounted to the panel using 3mm aluminium brackets or epoxy resin (not 5-minute setting epoxy - it cannot withstand heat). The outside should be painted black and the inside left natural, to limit heat build-up within the enclosure. Small fins (made by attaching aluminium angle to the flat plate) will help if you intend to push the system to maximum power. Bear in mind that to do so will result in considerable loudspeaker distortion, so if you are looking for high SPL then this is not the system for you.
If you wish to use a passive line-level network, please see the appendix to this article. You will need to refer to the ESP articles section to work out how to modify the output impedance of the drive amplifier. Bear in mind that the process of setting a specific output impedance with known gain is most easily done by empirical (derived from observation or experiment) techniques. While it is possible to calculate the impedance and gain, it is rather irksome to do so.
This article is about a method of building small closed-box speaker systems with better bass. This method involves inserting a response-shaping network of two resistors and some capacitors between the connection of the output stage of the power amplifier driving the speaker system and the input to the speaker system.
Small speaker systems are attractive in that they don't clutter a room and generally are much less expensive than their larger brethren. The drawback to most small closed-box speakers is that they lack the capability for full-bodied reproduction because typically the frequency at which bass roll-off is at half-power or f3 of them is too high. Small vented or bass-reflex speaker systems on the other hand can more easily be designed to include an acceptably low value of f3 but bass-reflex systems have the inherent tendency of producing indistinct and boomy reproduction in the bass range.
The contemporary solution to poor bass-response of small frontally located stereo speakers is the addition of a subwoofer to the music system. This solution perhaps only minimally increases the apparent clutter of audio reproducing equipment, but it does increase the total system cost and number of interconnections required. Also, if a single subwoofer reproduces the lower bass range of both left and right channels of program material, then there is some degradation of stereo effect. Testing of the human ability to localise the apparent sources of sounds as a function of frequency indicates that this ability is quite good in the bass range.
The response-shaping network of the closed-box two-way system that is the subject of this paper extends bass response in four ways, without requiring a large cabinet. Firstly, resonance magnification of the woofer or Qts is made equal to 0.5 by placing resistance in series with the woofer and interior volume of the system is established to cause system Q or Qtc to equal 0.71. Secondly, for frequencies less than 500 Hz and decreasing, attenuation of the voltage of the power amplifier driving the system and applied to the woofer and tweeter of the system in a passive crossover network is also decreasing. Thirdly, for frequency greater than 500Hz, the voltage attenuation factor of the shaping network is constant and equal to one-third. Finally, for frequency less than 500 Hz and decreasing, shunting impedance (the impedance through which back EMF operates) is increasing which means that Qts also increases. With interior volume of the system Vb fixed, increasing Qts causes Qtc or resonance magnification to increase. This causes improved conversion efficiency by the woofer.
As of the date of publication, the woofer and tweeter of the system that I describe here have been discontinued. Therefore, so that the confines in which the design that I've developed can be clearly seen and in case anyone else would wish to construct a speaker system similar to the one described here, given below are the relevant specifications of the drivers I used.
100mm (4") shielded aluminium cone woofer, MCM Electronics Stock Nr. 55-1853 (discontinued) -
19mm (¾") metal dome tweeter, PEI, MCM Electronics Stock Nr. 53-440 (discontinued) -
By the phrase "series resistor" I mean for example resistor R1 of Figure 1. In general, comparing the half-power frequency f3 of two closed-box speaker systems with identical woofers and resonating efficiency Qtc, the second system that includes a resistor connected in series with the voice coil of the woofer has a lower value of f3 than that of the first system lacking a series resistor.
The series resistor of the second system increases the resonance magnification of the woofer in free air (Qts). This occurs because the series resistor decreases the magnitude of back current produced by the woofer functioning reactively. With the woofer of the second system in free air having a higher resonance magnification than that of the first system, interior volume of the box of the second system is made larger than that of the first system as Qtc of both systems are to be identical. That is, less stiffness of the enclosed air of the second system is needed to obtain the desired value of Qtc than is needed by the first.
The enclosed air of the first system having greater stiffness causes the resonant frequency fc of the first system to be higher than that of the second system. This relationship can be understood by considering that stiffness of the enclosed air of a closed-box speaker system is modelled by a capacitor in the electromechanical equivalent circuit of that system. Greater stiffness of the enclosed air corresponds to decreased capacitance of that capacitor. Decreased capacitance causes the resonant frequency of the equivalent circuit to increase. As the values of Qtc of both systems are identical it follows that the ratios f3/ fc of both systems are identical and therefore f3 of the second system is lower than that of the first system.
A manipulation of the Thiele-Small equations for closed-box speakers that follows below shows the theoretical proof of this effect. Assuming that amplifier source resistance is negligible with respect to voice coil resistance re, then ...
Q*es = Qes * ( Rx + re / re ) (where Q*es = modified electrical Q, and Rx = series resistance)
Therefore it follows that ...
Q''es > Q'es (where Q'es and Q'' = electrical Q of the traditional and modified speaker systems respectively)
Total Q of the woofer or Qts is related to electrical Q or Qes & mechanical Q or Qms by the equation ...
Qts = Qes * Qms / ( Qes + Qms )
Therefore it also follows that ...
Q''ts > Q'ts (where Q'ts and Q''ts = total Q of the traditional and modified speaker systems respectively)
For a closed-box system, the equation relating the resonant frequency or fc of the system to Qts, the free air resonance of the woofer or fs and Qtc of the system is ...
fs = ( Qtc / Qts ) * fs
Both the first and second systems have equal fs and Qtc. Also, Qts of the second system is greater than that of the first system. Therefore the resonant frequency or fc of the second system is lower than that of the first system lacking a series resistor.
Where C is a constant and ...
C = ( 1 / Qtc² ) - 2
then ...
f3 = (C + √( ( C2 + 4 ) / 2 ) )1/2 * fc
As Qtc of both systems are equal, the above proportionality constant relating f3 to fc is also an identical factor for both systems. System resonance frequency fc of the second system is lower than that of the first. Thus, f3 of the second system is also lower than that of the first.
System resonance frequency fc equals [ Qtc / Qts ] times fs. Thus, where Qts is constant, reducing Qtc makes fc more nearly equal to fs. However, where Qtc is made less than 0.71, then the ratio of f3 / fc becomes greater than unity and more than counteracts the decreased ratio of fc with respect to fs. Making Qtc equal to 0.71 results in the lowest possible ratio of f3 with respect to fs.
Given that Qtc equal to 0.71 is made a constant, with the goal in mind of obtaining the most extended bass response from a system of small dimensions, then there is little benefit to making Qts greater than 0.5. If Qts is increased to 0.6, then interior volume Vb, formerly equal to Vas, must become equal to 2.6 times Vas. At the same time, fc is marginally reduced to 83% of its previous value.
The volume Vas of a small woofer of about 100mm in diameter, even where the woofer is of the acoustic suspension-type, and Vb of the closed-box for the woofer made equal to Vas does not result in an overly large speaker system. The drawback to this configuration is that it allows distortion to occur at a much lower power level of driving the woofer than would occur if the cone of the woofer were acoustically suspended.
Solve for modified Qts (Q*ts). Transposing the Thiele-Small equation expressing α or the ratio Vas / Vb as a function of Qtc and Qts ...
(Q*ts)² = Qtc² / α + 1
Making α equal to 1 gives the result that ...
Q*ts = 0.71 * Qtc
Solve for modified Qes or Q*es. Transposing the Thiele-Small equation expressing Qts as a function of Qes and Qms.
Q*es = ( Qms * Q*ts ) / ( Qms - Q*ts )
Solve for series resistance Rx assuming negligible amplifier source resistance. Transposing the equation relating Q*es to Qes, Rx and voice coil resistance re.
Rx = ( Q*es - Qes ) * re / Qes
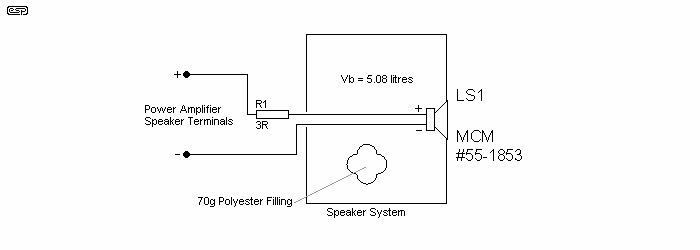
Figure 1 - Closed-box speaker system with series
resistance only, Qtc = 0.7 and α = 1
The woofer of the speaker system of Figure 2, the drivers of the system of Figure 1 and a control speaker system are all identical. The driver of the control speaker system is directly connected to the speaker terminals of the power amplifier and installed in a closed box of 2 litres (122 cubic inches) internal volume.
The selected value of resistance of series resistor R1 of the system of Figure 1 is based on the calculations of the previous section given that Qtc = 0.71 and α = 1. The effective internal volume or Vb of the system of Figure 1 is somewhat greater than the actual internal volume or Vint due to the presence of 'Acousta Stuf' or similar polyester filling material in the box. (Acousta Stuf is a brand of acoustic absorption / dampening fibre.)
Table 1 is a collection of calculated and measured characteristics of the control speaker system and the systems of Figure 1 and Figure 2 The system of Figure 2 has a response-shaping network that includes a 3Ω series resistor. The design of the system of Figure 2 is discussed in the next section. Although there is a fair amount of divergence between the measured and calculated values of fc and f3 of the control speaker system and the system of Figure 1, in both cases fc and f3 of the system including the 3 Ω series resistor are lower relative to those of the control system.
Figure 3 is a graph of measured sound intensity output or SPL versus frequency of the three systems. Frequency response of each of the three systems was measured under the same conditions and SPL corresponding to frequency equal to 1 kHz designated the reference level or 0dB at Figure 3. SPL at frequencies less than 1 kHz of each system is shown at Figure 3 relative to SPL of that system at 1 kHz. As opposed to graphing the absolute readings of SPL, this method of graphing allows one to easily compare variations of frequency response of the three systems. Compared to the control system, overall sensitivity of the systems of Figures 1 and 2 is diminished.
For the frequency range of 40 Hz- 80 Hz, the graph of Figure 3 indicates that relative sound intensity output of the system of Figure 1 including a 3 Ω series resistor is about four times that of the control system.
| Speaker System | fc | f3 | α Vas / Vb |
Qts | ||
|---|---|---|---|---|---|---|
| Calculated (Hz) | Measured (Hz) | Calculated (Hz) | Measured (Hz) | |||
| Control | 112 | 90 | 112 | 105 | 2.5 | 0.71 |
| Fig. 1, Series R | 85 | 75 | 85 | 80 | 1.0 | 0.72 |
| Fig. 2, pikku 9 | 85 | 80 | - | 55 | 1.0 | 0.6-0.68 |
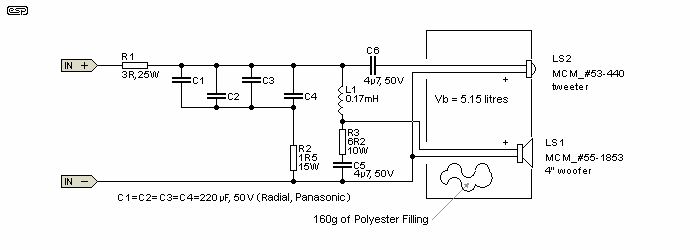
Figure 2 - Full-range system (pikku 9) with response-shaping network
Figure. 4 shows the response-shaping network of the pikku 9 speaker system of Figure 2. As a result of trial and error experimentation, the value of resistance of resistor R2 is made equal to one-half that of resistor R1 or 1.5 ohms
The quantity of capacitance that is to be placed in series with resistor R2 across the terminals of woofer LS1 can be estimated by solving the following two equations. First solve for XCT ...
XCT = 1.15 * √( 0.25 * RT² - R2² ) (where RT = R1 + R2)
XCT of the above equation is the reactance of the total capacitance in series with resistor R2 causing one-half of the input voltage to drop across resistor R1. Secondly solve for the total capacitance CT to be connected in series with resistor R2 according the equation,
CT = 1 / 6.28 * fc * XCT
Where, assuming that Qtc and Qts are very nearly equal to respectively 0.71 and 0.50, fc = 1.42 fs.
Frequency response of the speaker system should be measured where total capacitance in series with R2 is varied in the range of perhaps ±25% of the value of CT solved for above.
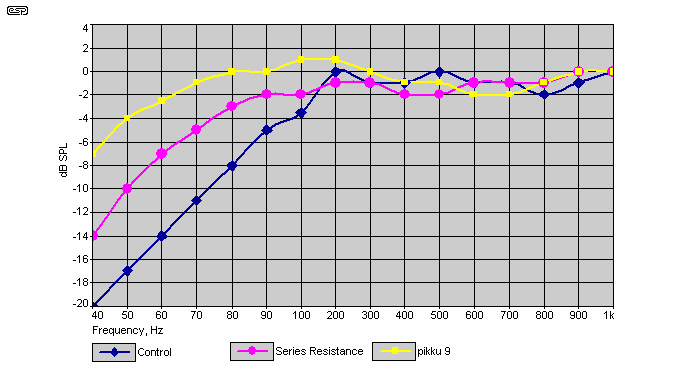
Figure 3 - Relative Response
Relative SPL versus frequency referenced to SPL at 1 kHz of the control speaker system with no network, the system of Figure 1 with in-series resistance only and the system of Figure 2 with a shaping network.
See Figure 4. For frequency equal to 500 Hz, reactance of capacitors C1-C4 is fairly negligible relative to the resistance of resistor R2 and an equivalent circuit would omit capacitors C1-C4 and show only resistor R2 connected across the input terminals of woofer LS1. Therefore about one-third of the system input voltage drops across the input terminals of woofer LS1 at 500 Hz. As frequency decreases from 500 Hz, increasing reactance of parallel-connected capacitors C1-C4 causes a greater portion of the system input voltage to drop across the input terminals of woofer LS1. The (sine wave) frequency at which the measured RMS voltage taken across the input terminals of woofer LS1 equaled one-half the RMS voltage of the system input voltage was 85 Hz.
For frequency equal to 40 Hz, 55 Hz or f3 of the pikku 9 of Figure 2, 85 Hz, 200 Hz and 476 Hz, the calculated (theoretical) voltage attenuation factor equals respectively 0.67, 0.57, 0.46, 0.36 and 0.34. Given an equal system input voltage, electrical power supplied to woofer LS1 is 6dB greater at 40 Hz relative to that which occurs at any frequency greater than 500 Hz.
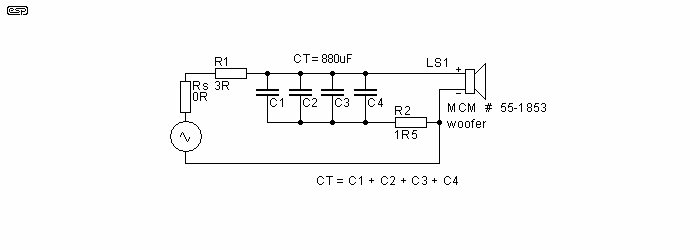
Figure 4 - Equivalent Circuit
Figure 4 shows an electrical equivalent to the schematic of Figure 2, where the frequency of the input signal not greater than about 500 Hz. The resistor Rs is the equivalent of amplifier source resistance.
The effectiveness of woofer LS1 functioning as a generator in opposition to the electrical signal applied across its input terminals in inversely proportional to shunting impedance. A first shunting impedance path consists of resistors R1 and Rs connected in series across the input terminals of woofer LS1. Resistor R2 connected in series with parallel-connected capacitors C1-C4 across the input terminals of LS1 is a second shunting path. Impedance of the second shunting path varies directly with the reactance of capacitors C1-C4.
As was stated earlier,
Q*es = modified Qes = Qes * ( ( Rx + re ) / re )
However, here we now define RX as the total shunting impedance. Modified Qes is directly proportional to RX and modified Qts is directly proportional to modified Qes. Given that
α = Vas / Vb
then
Qtc² = ( α + 1 ) * ( Q*ts )²
and therefore
Qtc is directly proportional to RX
Using phasor algebra, I calculated total shunting impedance of the pikku 9 based on the equivalent circuit of Figure 4 for frequency equal to 40 Hz, 80 Hz and 200 Hz. For each frequency I calculated modified Qes as a function of the magnitude of total shunting impedance RX and then solved for modified Qts. Finally I solved for Qtc. The result of these calculations is shown graphically at Figure 5 and indicates that, for frequency decreasing from 200 Hz, increasing Qtc or resonance magnification might act to extend bass response.
The above calculations only take into account the magnitude while disregarding phase angle of shunting impedance. The phase of the generated electrical signal is not 180° out of phase with the applied electrical signal where the phase angle of total shunting impedance does not equal 0°. The extent to which the opposing or generated electrical signal varies from 180° out of phase with the applied electrical signal decreases damping which is the same as increasing Qtc. It is therefore suspected that the variation of Qtc of the speaker system of Figure 2 in the bass range is probably in reality greater than indicated at Table 1 and Figure 5. Where frequency is greater than 500 Hz resulting in XCT being negligible with respect to the resistance of resistor R2, then Qtc is less than 0.6.
Placing a sound level meter very close to woofer LS1 and applying a 1 kHz sine wave signal at input to the system, I extrapolated to get a sensitivity figure of 76dB at 1W/ 1m. Note that this value of sensitivity is very nearly equal to the sensitivity of LS1 equal to 86dB minus 20log10 of 0.33 or the maximum voltage-attenuating factor of the response-shaping network of Figure 2.
The most common reaction to my design of Figure 2 thus far has been that the sensitivity is too low for it to be considered practical and that therefore response shaping should occur at line level prior to power amplification. Here I want to show that sensitivity of my design is not debilitating. In the next section I suggest that it may be quite beneficial to propose a speaker system that presents a load to power amplifiers that is less complex than that of most other systems.
The following analysis is according to that given by V. Capel [ 1] in chapter 6 of his book. A closed-box system is a monopole sound source when reproducing signals of a wavelength surpassing the dimensions of the box. For this type of source, SPL drops by 6dB for each doubling of distance from it at distances greater than 1 metre.
To increase the level of the system of Figure 2 to 87dB at 1 meter requires increasing input wattage by 11dB, which means that input wattage must be increased from 1W to 12.6W. To maintain SPL equal to 87dB listening 2 meters (or 6.6 feet) distant from it requires increasing input power fourfold or to 50.4W. Listening to a pair of the system of Figure 2 at a distance of 2 meters increases SPL to 90dB or that of a symphony orchestra playing at the loudest level heard from a good seat in a concert hall with good acoustics. Thus an amplifier rated at 50W to 60W per channel RMS into a 4 ohm load is adequate to drive the system of Figure 2 to loud levels. Amplifiers currently available with this power rating or better are not uncommon nor especially expensive.
Referring to the complex impedance of a loudspeaker, Vance Dickason states [2] that, "Phase angles in excess of 40° at low frequencies, and the same at frequencies about 1-2 kHz, can be considered as a somewhat difficult load for an amplifier to drive." Also on p.129 of the same book he says "The extent to which the load is either capacitively or inductively reactive at different frequencies determines how happy or unhappy an amplifier will be driving a particular loudspeaker."
Michael Renardson in his paper [3] states that, "Although many loudspeakers are specified as having an impedance of 8Ω there is usually large variation throughout the audio frequency range with typical variations in a given loudspeaker from 5 to 40 ohms and significant reactive components. The distortion produced by an amplifier with a loudspeaker load will therefore be different from that with an 8 ohm resistor and the total harmonic distortion figure is typically 10dB higher over much of the frequency range and in some cases considerably worse."
Impedance of woofer LS1 of Figure 4 equals 10Ω at a frequency of 150 Hz, increases to a maximum of 29Ω at 80 Hz and equals 21Ω at 60 Hz. Thus, without excessive impairment of the accuracy of the analysis, the phase angle and impedance of the load presented to an amplifier driving the speaker system of Figure 4 can be calculated disregarding the impedance of LS1 connected across the series connection of capacitors C1~ C4 and resistor R2. At frequency equal to 40 Hz and 55 Hz, phase angle of the response-shaping network consisting of resistor R1, capacitors C1~ C4 and resistor R2 equals (respectively) 45° and 36°. At frequencies greater than 500 Hz the phase angle is 0°. Impedance of the response shaping network at frequency equal to 40 Hz and 500 Hz is respectively 6.4Ω and 4.5Ω.
For frequency equal to or greater than the cut-off frequency f3 of the system of Figure 2 or 55 Hz, the phase angle of the load of that system is less than 40° and thus according to Dickason should be less of a difficult load for an amplifier to drive than is sometimes encountered. Variation of impedance of the system of Figure 2 is only from about (slightly less than) 4.5Ω to 6.4Ω which is much less of an impedance swing than normal. The small impedance swing of the system of Figure 2 presumably reduces total harmonic distortion based on the statement of Renardson.

Figure 5 - Estimated Qtc of the pikku 9 System of
Figure 2 as a Function of Frequency in the Lower Bass Range
Nominal impedance of tweeter LS2 is 8Ω and reactance of capacitor C6 is 8Ω at 4 kHz. Thus the crossover frequency of the first order high-pass filter consisting of capacitor C6 in series with tweeter LS2 is 4 kHz. Tweeter LS2 is reverse-wired (+ speaker terminal to - input). Resistor R3 and capacitor C5 connected in series across the input terminals of woofer LS1 are a Zobel network compensating for rising impedance of LS1. The values of R3 and C5 indicated at Figure 2 are less than recommended by rules of thumb and were arrived at by trial and error.
At a frequency equal to 4 kHz, the reactance of inductor L1 equals 4.3Ω and thus is nearly one-half the nominal 8Ω impedance of woofer LS1. However the crossover frequency of the low-pass filter consisting of choke L1 in series with woofer LS1 still is equal to about 4 kHz due to the influence of the Zobel network.
Resistors R1 and R3 cannot be installed inside the closed box of the speaker system and must be ventilated as they dissipate considerable heat when the speaker system is driven at high volume.
Shown at Table 1, half-power frequency f3 of the pikku 9 is almost half that of the control speaker system. At Figure 3, sound intensity output of the pikku 9 doesn't exceed +1dB. Thus I consider the type of passive bass-boosting network presented here as a successful solution to the problem of extending the bass response of small closed-box speaker systems where reduced power handling can be tolerated.
As noted in the introduction, the equalisation can be done at line level, using a network between the preamp and power amp. You will still need to adapt the amplifier (using current feedback derived from the speaker return lead) to present the desired impedance to the loudspeaker. This method allows maximum efficiency from the speaker system, but because of the bass boost circuit, the low end of the signal will cause the amplifier to clip much earlier than normal. The main benefit is that you don't need the high power resistors and large capacitance. The crossover is still needed, naturally enough (you may want to try a series connection for the crossover, but that will require some additional changes).
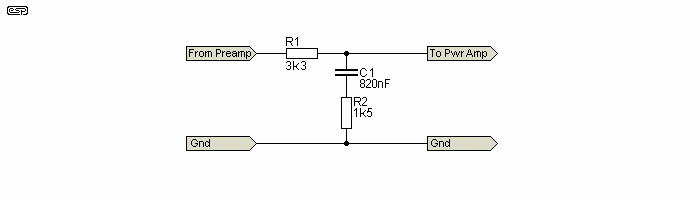
Figure 6 - Line Level EQ Circuit
Figure 6 shows a line level implementation of the equalisation network. Response is almost identical, and is easily tailored during the experimentation phase using trimpots. Response is almost unaffected with any power amplifier input impedance of 10k or more, so it is easy to integrate. Source impedance should be as low as possible, but almost all transistor or IC preamps will have no trouble. If you use a valve (tube) preamp, then you will need a buffer stage before the equaliser.
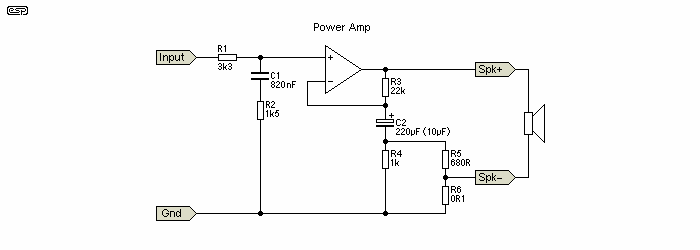
Figure 7 - Power Amp With 3 Ohms Output Impedance
Note that the amp circuit is shown with the equalisation network at the input. The power amp is simply shown as an opamp in the above, but the process will work with almost any amplifier. Of the ESP projects, you could use P3A, P19, P27A (guitar amp), P72 or P101 with no major problems at all. The gain as shown is 22dB (~12.4) at 1kHz with a resistive 8 ohm load, but this will change if load impedance is varied. This is normal for any amp with a defined (high) output impedance. The gain at 50Hz is 28.5dB (26.6) because of the filter network. With C2 at the more typical value of around 220uF, the EQ circuit applies bass boost all the way down to below 10Hz (the speaker level circuit does the same thing). This is likely to cause unwanted and possibly excessive cone movement at frequencies that the driver cannot reproduce, and may cause more intermodulation distortion than might otherwise be the case. Reducing C2 to 10uF creates a high pass filter, limiting the total bass boost to about 6dB, and rolling off below 35Hz.
There are no losses in this implementation, other than the normal losses within the amp itself. It is important to understand that the maximum power rating of the speaker should not be exceeded, or you will get considerable intermodulation distortion because of speaker overdrive. Like Peter's implementation, this version should only be considered as a low level system, although one can expect an average SPL of around 90dB at the listening position quite easily.
Main Index
Articles Index